Air
The Group’s corporate carbon footprint report is an important tool for improving climate protection. After determining our indirect greenhouse gas emissions from bought-in energy (as per Greenhouse Gas Protocol Scope 2) for the first time in 2011, we have also been measuring our Scope 3 emissions since 2012. These include emissions generated along the supply chain, e.g. by suppliers or through waste disposal and the transportation of products.
Groupwide, carbon dioxide emissions that result from captive power plants subject to emissions trading rules and from silicon-metal production in Holla, Norway, totaled about 1.09 million metric tons in 2014 (2013: 1.08 million metric tons). WACKER is subject to European emissions trading at its Burghausen and Nünchritz CHP plants. Procurement of emission allowances has been included in energy procurement planning since 2013. Having achieved a surplus in the second trading period (2008 through 2012), we did not have to purchase additional emission allowances for 2013. Based on a shortfall in 2014, we bought emission allowances for the facilities we own and operate and that are subject to emissions trading rules.
In the 2014 fiscal year, we once again forwarded our emissions data to the Carbon Disclosure Project (CDP), which WACKER joined in 2007. Founded in London in 2000, CDP is a non-profit organization working to achieve greater transparency in greenhouse gas emissions.
In 2014, WACKER was listed for the first time in the Carbon Disclosure Leadership Index (CDLI) for the German-speaking region (Germany, Austria, Switzerland and South Tyrol), having achieved a score of 95 B. We thus outperformed our peer group in the MDAX in this respect. Since 2013, with a result of 86 B, we have defined our CO2-reduction target and expanded our reporting on opportunities, risks and indirect emissions from the supply chain (Scope 3).
Since the fall of 2013, we have been participants in the myccf project of co2ncept plus (German-language website) – a German association of businesses with interests in emissions trading and climate protection issues. In this project, which is supported by the German Federal Environmental Foundation (DBU), we are developing our corporate carbon footprint (CCF) further. We want to expand our reporting on indirect emissions generated along the supply chain (Scope 3).
WACKER performed well in an assessment by rating agency oekom research AG with an overall grade of B–. oekom’s rating methodology classifies WACKER as “Prime.”
Direct Emissions
Based on carbon dioxide equivalents, carbon dioxide (CO2) makes up approximately 98 percent of WACKER’s direct greenhouse gas emissions. The remainder is made up of nitrous oxide, methane, fluorocarbons and other greenhouse gases. These also include nitrogen trifluoride, which we determined groupwide for the first time in 2014. We looked at methane emissions from combustion processes in detail in 2014, too. With the aid of an emission factor specified by the authorities, we accounted for additional methane emissions from our combustion processes and corrected them as far back as 2012. Over the coming years, we will compare the emission factors with actual methane emission measurements.
In 2013, we optimized the processes of the Burghausen site’s gas turbine during a scheduled shutdown. Due to the facility’s extended availability in 2014 and an increase in electricity production at the Burghausen power plant, direct carbon dioxide emissions rose. At the Nünchritz site, we were able to save on direct carbon dioxide emissions by optimizing the integrated production system. As a result, significantly less steam had to be generated from primary energy sources. Overall, this brings the direct carbon dioxide emissions in 2014 to the same level as in 2013. The rise in direct nitrous oxide (N2O) emissions between 2012 and 2014 is due to increased production at the Portland site and consolidated reporting at the Singapore site, which was implemented in 2014.
| Download XLS |
|
|
|
|
|
|||||||||
|
|
|
|
||||||||||
|
|
2014 |
2013 |
2012 |
|||||||||
|
||||||||||||
|
|
|
|
|
|||||||||
|
CO2 carbon dioxide1 |
|
|
|
|||||||||
|
Direct (kt) |
1,251 |
1,253 |
1,311 |
|||||||||
|
Indirect (kt) |
1,420 |
1,241 |
1,133 |
|||||||||
|
|
|
|
|
|||||||||
|
Other greenhouse gases |
|
|
|
|||||||||
|
CH4 methane (t)2 |
81 |
82 |
85 |
|||||||||
|
N2O nitrous oxide (t) |
64 |
43 |
34 |
|||||||||
|
HFC hydrofluorocarbons (t) |
6 |
7 |
5 |
|||||||||
|
PFC perfluorocarbons (t) |
0.059 |
0.059 |
0.059 |
|||||||||
|
NF3 nitrogen trifluoride (t)3 |
0.008 |
– |
– |
|||||||||
|
SF6 sulfur hexafluoride (t) |
0.000 |
0.002 |
0.011 |
|||||||||
|
|
|
|
||||||||||
| Download XLS |
|
|
|
|
|
|
||||||||||||||
|
|
|
|
|
|||||||||||||||
|
kt CO2e1 |
GWP factor2 |
2014 |
2013 |
2012 |
||||||||||||||
|
||||||||||||||||||
|
|
|
|
|
|
||||||||||||||
|
CO2 carbon dioxide3 |
1 |
1,251.08 |
1,252.58 |
1,311.48 |
||||||||||||||
|
CH4 methane4 |
25 |
2.03 |
2.05 |
2.13 |
||||||||||||||
|
N2O nitrous oxide |
298 |
19.00 |
12.81 |
10.07 |
||||||||||||||
|
HFC hydrofluorocarbons |
1,430 |
8.54 |
10.01 |
7.44 |
||||||||||||||
|
PFC perfluorocarbons |
9,800 |
0.58 |
0.58 |
0.58 |
||||||||||||||
|
NF3 nitrogen trifluoride5 |
17,200 |
0.14 |
– |
– |
||||||||||||||
|
SF6 sulfur hexafluoride |
22,800 |
0.00 |
0.05 |
0.26 |
||||||||||||||
|
|
|
|
|
|||||||||||||||
Emission of Air Pollutants
We made considerable progress in the emission of nitrogen oxides in 2013 and 2014 by optimizing the integrated heat-utilization system at the Burghausen site. Despite increased electricity generation and extended availability of the Burghausen gas turbine in 2014, direct nitrogen oxide emissions fell by 12 percent compared to 2012. We used measurements and calculations at Burghausen to show that exposure to NOx/NH3 emissions in the site’s surroundings, on average, is in line with typical background concentrations. Overall nitrogen deposition is within the limits for maximum background levels in rural areas.
In the evaluation of total emissions of non-methane volatile organic compounds (NMVOCs), we amended our assessment methodology in 2014. This was triggered by the construction of a new WACKER POLYMERS dispersible polymer powder plant in Burghausen. We have retroactively corrected the emissions data from our spray dryers in Burghausen, Calvert City and Nanjing in accordance with the new method. The 2014 rise in values is due to production increases.
The Air Is Cleaner
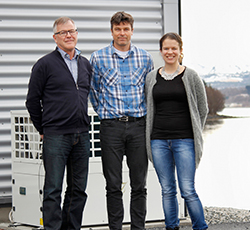
There from the start – when the silicon-metal site in Holla, Norway, was integrated into the WACKER Group in 2010: (from left to right) Einar Olav Schei, Torbjørn Halland and Silje Lian Gridsvåg.
Since WACKER acquired the Norwegian site in Holla in 2010, continuous expansion of environmental protection has been on the agenda for the energy-intensive silicon-metal production there. The team has now optimized the maintenance of equipment that removes dust from silicon metal production. These measures have significantly reduced emissions.
At the Holla site, the coordination between mechanical and electrical servicing of separation equipment and the accompanying systematic equipment maintenance has been completely revised. The result is enhanced and reliable maintenance of dust removal. At the same time, the equipment availability has been increased beyond what is required.
The measures have led to significantly reduced emissions. At a production capacity of 82,844 metric tons, 560 metric tons of dust were emitted in 2013. In 2014, at an increased production capacity of 84,580 metric tons, the dust emissions were down to 384 metric tons.
| Download XLS |
|
|
|
|
|
|||||||||||||
|
|
|
|
||||||||||||||
|
t |
2014 |
2013 |
2012 |
|||||||||||||
|
||||||||||||||||
|
|
|
|
|
|||||||||||||
|
NOx nitrogen oxides1 (t) |
1,960 |
2,010 |
2,225 |
|||||||||||||
|
NMVOC non-methane2 volatile organic compounds (t) |
830 |
750 |
720 |
|||||||||||||
|
CO carbon monoxide (t)3 |
347 |
346 |
351 |
|||||||||||||
|
Dust (t)4 |
408 |
588 |
591 |
|||||||||||||
|
Particulate matter (t)5 |
349 |
499 |
500 |
|||||||||||||
|
|
|
|
||||||||||||||
Indirect Emissions
Our indirect CO2 emissions from procured energy (as per Greenhouse Gas Protocol Scope 2) rose to 1,420,000 metric tons in 2014 (2013: 1,241,000 metric tons). This was due to increased production volumes, particularly of polysilicon at the Burghausen and Nünchritz sites. We used energy-efficiency measures to reduce weighted specific energy consumption and the associated specific CO2 emissions – while maintaining a comparable product portfolio.
The rise in Scope 2 emissions in 2013 was caused not only by increased production capacity for polysilicon at the Nünchritz site, but also by a shift from Scope 1 to Scope 2 emissions due to the planned shutdown of a gas turbine at the Burghausen site. One-fourth of the increase is caused by the annual update of regional emission factors used in calculating greenhouse gas emissions.
Sustainable Mobility Strategy
When it comes to climate protection, production is not the only factor – our employees’ carbon footprint is also significant. We encourage them to leave their cars at home. We provide commuter buses for shift workers at Burghausen, our largest site. Together with nine bus companies, we have set up some 56 bus routes within a 50-km radius. Some 3,500 people use our shuttle service every day. 5,000 of our Burghausen employees have annual tickets.
At our Burghausen site, we maintain a fleet of around 6,000 bicycles and offer our employees charging facilities for their e-bikes. Our Nünchritz site has a fleet of 950 bicycles.
Since 2011, our company car fleet in Germany has only included models that meet a minimum rating of “good” according to the safety and environmental assessment criteria issued by the German Automobile Association (ADAC). We have tightened the CO2 emissions limits for our company cars to a maximum of 110 to 175 g/km. Our fleet average is 139 g/km. At an annual average of 30,000 km traveled per car, we lowered CO2 emissions by almost 8 percent in the period under review, relative to 2012. We replaced all the older models by 2014 and thus reduced the vehicle fleet’s annual CO2 emissions by more than 16 percent compared with 2010.
WACKER offers frequent travelers and employees who use company cars the opportunity of participating in safety and eco training. WACKER organizes safety weeks at its sites at regular intervals; sustainable mobility topics are covered there. We are looking at incentive systems that will motivate managerial employees even more to switch to environmentally friendly vehicles with alternative drives.
We encourage our employees to take the train when traveling between the Burghausen site and Munich headquarters. And we have negotiated a special ticket for this regular route with SüdOstBayernBahn, which includes public transport (e.g. the subway to the headquarters). An additional appeal of the special corporate ticket is a bonus card for frequent travelers, which we tested as a pilot project in the period under review. WACKER also provides employees with German Rail “Bahncards.”
In Burghausen, a shuttle bus picks up employees arriving from Munich at the train station and transports them to various destinations on site. Since 2012, a zero-emission shuttle bus for visitors has been used on the site. Electric vehicles have been part of our pool fleet since 2013. When we choose contracting companies for passenger transport, we ask what type of vehicles the bidders use and assess their safety and environmental impact.
During the period under review, we tested hydrogen-powered vehicles, but decided that electric vehicles are more suitable for us. The electric drive does not generate exhaust gases, is quiet and has low operating and maintenance costs, as it requires less servicing. A hydrogen-driven industrial truck currently costs 300 percent more than an electric vehicle. Added to this would be high costs for the necessary infrastructure measures.
We also use electric drives for forklift trucks and the like. Over two thirds of the materials-handling equipment (lifting trucks, stackers and towing vehicles) at our Burghausen and Nünchritz sites now have electric motors. Groupwide, the switchover to energy-saving electric motors now covers other equipment, such as pumps and compressors.
In China, we offer shuttle buses from residential areas to our sites in Nanjing, Shanghai and Zhangjiagang. Siltronic’s US site at Portland (Oregon) provides incentives – such as subsidized public transportation – to encourage employees to commute in an environmentally aware fashion. In Singapore, Siltronic has arranged for shuttle buses to travel from the site to various parts of the city. Employees at Siltronic in Japan have two days a month when, rather than driving their own car, they walk, bike, car-share or use public transport to get to work.