Cash Flow
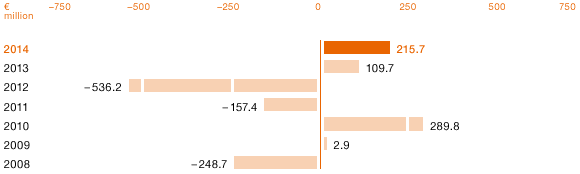
In 2014, WACKER complied with its long-term policy of essentially financing its investments from its own cash flow. Net cash flow totaled € 215.7 million in 2014 (2013: € 109.7 million), demonstrating that long-term investments are predominantly covered by the cash flow from operating activities.
Net Cash Flow
| Download XLS |
|
|
|
|
||
|
€ million |
2014 |
2013 |
||
|
|
|
|
||
|
Cash flow from operating activities (gross cash flow) |
485.2 |
464.0 |
||
|
Changes in advance payments received |
227.8 |
200.9 |
||
|
Cash flow from long-term investing activities before securities |
-497.3 |
-555.2 |
||
|
Net cash flow |
215.7 |
109.7 |
||
|
|
|
|
Net cash flow is the sum of cash flow from operating activities (excluding the change in advance payments) and cash flow from long-term investing activities (before securities), including additions due to finance leases.
Net Cash Flow

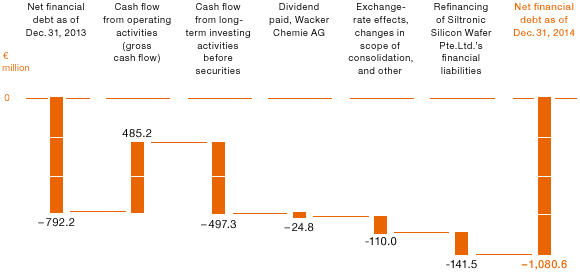
Net Financial Debt
Financial liabilities amounted to € 1.60 billion as of December 31, 2014 (Dec. 31, 2013: € 1.42 billion), up € 184.8 million year on year. In Q3 2014, WACKER drew down a new long-term loan of € 80.0 million. In China, we took out new long-term loans at current market interest rates in Q1 to finance our companies there. The purpose of these loans is to refinance the existing working capital credit facilities and project financing. Financial liabilities increased by about € 70 million due to currency effects.
WACKER defines net financial debt – which is one of its financial indicators – as the balance of gross financial debt (current and noncurrent financial liabilities) and existing noncurrent and current liquidity, consisting of securities, cash and cash equivalents. In the period under review, net financial debt grew substantially. The increase of € 288.4 million to € 1,080.6 million (Dec. 31, 2013: € 792.2 million) is basically due to investments and the refinancing of Siltronic Silicon Wafer Pte. Ltd. In 2014, WACKER invested € 572.2 million, which corresponds to an investment ratio of 12 percent (2013: 11 percent), based on Group sales.
Aside from the financial liabilities disclosed in the report on net assets, WACKER has at its disposal adequate unused syndicated loans for some € 600 million with maturities of over one year. In December, WACKER replaced an existing unused syndicated line of credit with a line of credit of € 200 million with a maturity of five years. The latter is available as a liquidity reserve. Our existing lines of credit provide us with enough financial scope to secure the Group’s continued growth. The Group does not use any off-balance-sheet financing instruments.
Net Financial Debt

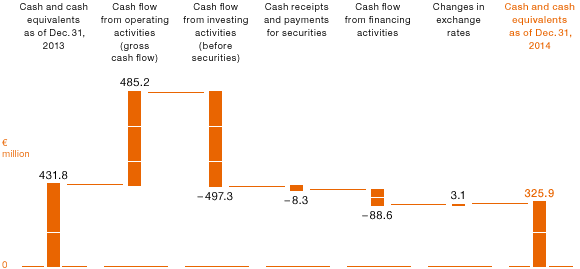
Trend in Cash and Cash Equivalents
Cash flow (with its components) shows the change in cash and cash equivalents in the period under review.
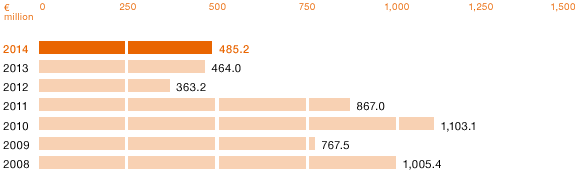
Gross Cash Flow
Cash flow from operations (gross cash flow) totaled € 485.2 million in 2014 (2013: € 464.0 million), an increase of almost 5 percent. The higher net income for the year of € 195.4 million had a positive impact. It comprised non-cash expenses and income amounting to € -48.7 million. Depreciation totaling € 599.0 million (2013: € 564.4 million) and changes in provisions in the amount of € 87.0 million (2013: € 47.3 million) had a positive effect on gross cash flow. The increase in working capital (trade receivables less trade payables, plus inventories) reduced gross cash flow by € 107.8 million. In particular, trade receivables and inventories increased as business volumes grew. Advance payments received for polysilicon deliveries changed during the year by € -227.8 million (2013: € -200.9 million) due to deliveries made and advance payments retained in connection with restructured or terminated contracts.
Cash Flow from Operating Activities (Gross Cash Flow)

Cash Flow from Investing Activities
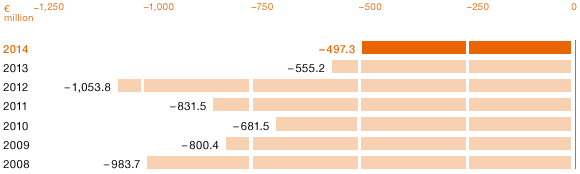
The Group’s investment projects influence cash flow from long-term investing activities. In 2014, more than half of investment spending went toward construction of the polysilicon production plant in Charleston, Tennessee (USA). Cash flow from long-term investing activities decreased from € 555.2 million in 2013 to € 497.3 million. Acquisitions made in Q1 2014 resulted in a cash inflow of € 25.8 million. This figure essentially represents the sum of cash and cash equivalents at Siltronic Silicon Wafer Pte. Ltd., which was included in the consolidated financial statements for the first time.
Cash Flow from Long-Term Investing Activities before Securities

Cash flow from long-term investing activities during the reporting period amounted to € -505.6 million (2013: € -449.5 million). Alongside investments in noncurrent assets and acquisitions, it included cash receipts and payments for securities and fixed deposits with maturities of more than three months.
Cash Flow from Financing Activities
Cash flow from financing activities totaled € -88.6 million in 2014 (2013: € 227.6 million). It mainly comprises the cash outflow from repayment of Siltronic Silicon Wafer Pte. Ltd.’s external financial liabilities following Siltronic’s acquisition of a majority stake in that company. The capital payment and additional payments were used to redeem SSW’s bank loans. The dividend payment by Wacker Chemie AG in the second quarter of 2014 also led to a cash outflow of € 24.8 million. In Q3 2014, WACKER’s cash flow from financing activities increased by € 80 million when a long-term loan was drawn down. In 2013, the cash received under the new private placement of US$ 400 million had enhanced cash flow from financing activities.
Cash and cash equivalents decreased by € 105.9 million compared with December 31, 2013. In 2013, the company had posted a cash inflow of € 239.2 million. As of December 31, 2014, cash and cash and cash equivalents amounted to € 325.9 million (December 31, 2013: € 431.8 million).
Changes in Cash and Cash Equivalents