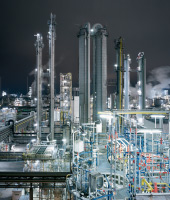
WACKER POLYSILICON
WACKER POLYSILICON’s sales rose substantially in 2014, up 13.5 percent to € 1.05 billion (2013: € 924.2 million). The increase was due to higher volumes and better prices. The photovoltaic market continued expanding. The amicable agreement reached with the Chinese Ministry of Commerce (MOFCOM) regarding the export to China of polysilicon produced in Europe was of special significance for WACKER’s business performance. Under the agreement, which came into effect on May 1, 2014, WACKER has undertaken not to sell polysilicon below a specific minimum price that is based on standard market prices. In return, MOFCOM has agreed not to impose anti-dumping or anti-subsidy tariffs on polysilicon made by WACKER. Regionally, Asia’s importance as a sales market increased.
EBITDA more than doubled, climbing to € 537.0 million (2013: € 233.9 million). Factors supporting this positive earnings trend were higher polysilicon prices and special income. In total, the business division posted € 206.3 million in income from the retention of advance payments and the receipt of damages in connection with the termination or restructuring of customer contracts. The EBITDA margin reached 51.2 percent (2013: 25.3 percent).
Investments Rise
Investments at WACKER POLYSILICON increased in 2014, up 15.3 percent to € 334.5 million (2013: € 290.0 million). Most of these capital expenditures went toward construction of the new polysilicon site in Charleston, Tennessee (USA), where production is set to start up in the second half of 2015.
The division’s workforce declined slightly, falling to 2,093 employees (Dec. 31, 2013: 2,102).
Key Data: WACKER POLYSILICON
| Download XLS |
|
|
|
|
||||||||||||
|
€ million |
2014 |
2013 |
2012 |
2011 |
2010 |
2009 |
2008 |
|||||||
|
|
|
|
|
|
|
|
|
|||||||
|
Total sales |
1,049.1 |
924.2 |
1,135.8 |
1,447.7 |
1,368.7 |
1,121.2 |
828.1 |
|||||||
|
EBITDA |
537.0 |
233.9 |
427.5 |
747.3 |
733.4 |
520.8 |
422.0 |
|||||||
|
EBITDA margin (%) |
51.2 |
25.3 |
37.6 |
51.6 |
53.6 |
46.5 |
51.0 |
|||||||
|
305.3 |
0.1 |
200.8 |
545.6 |
586.7 |
414.1 |
349.8 |
||||||||
|
Investments |
334.5 |
290.0 |
698.1 |
566.5 |
309.9 |
400.1 |
410.3 |
|||||||
|
Employees (December 31, number) |
2,093 |
2,102 |
2,349 |
2,251 |
1,763 |
1,600 |
1,289 |
|||||||
|
|
|
|
|
|
|
|
|
|||||||


