WACKER at a Glance
| Download XLS |
|
|
|
|
||||||||||||||
|
€ million |
2014 |
2013 |
Change in % |
|||||||||||||
|
|
|
|
|
|||||||||||||
|
||||||||||||||||
|
Results / Return |
|
|
|
|||||||||||||
|
Sales |
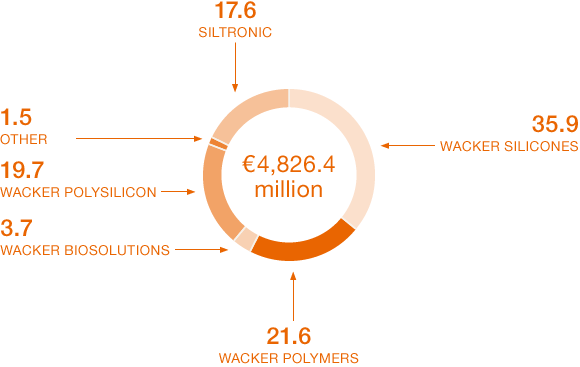
4,826.4 |
4,478.9 |
7.8 |
|||||||||||||
|
1,042.3 |
678.7 |
53.6 |
||||||||||||||
|
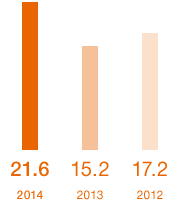
EBITDA margin2 (%) |
21.6 |
15.2 |
n. a. |
|||||||||||||
|
EBIT3 |
443.3 |
114.3 |
> 100 |
|||||||||||||
|
EBIT margin2 (%) |
9.2 |
2.6 |
n. a. |
|||||||||||||
|
|
|
|
|
|||||||||||||
|
Financial result |
-78.1 |
-83.3 |
-6.2 |
|||||||||||||
|
Income before taxes |
365.2 |
31.0 |
> 100 |
|||||||||||||
|
Net income for the year |
195.4 |
6.3 |
> 100 |
|||||||||||||
|
|
|
|
|
|||||||||||||
|
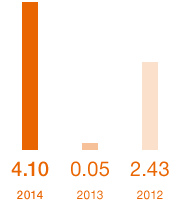
Earnings per share (basic / diluted) (€) |
4.10 |
0.05 |
> 100 |
|||||||||||||
|
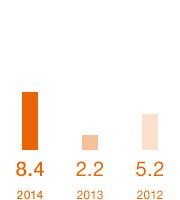
ROCE (%) |
8.4 |
2.2 |
n. a. |
|||||||||||||
|
|
|
|
|
|||||||||||||
|
Financial Position / Cash Flows |
|
|
|
|||||||||||||
|
Total assets |
6,947.2 |
6,332.4 |
9.7 |
|||||||||||||
|
Equity |
1,946.5 |
2,197.1 |
-11.4 |
|||||||||||||
|
Equity ratio (%) |
28.0 |
34.7 |
n. a. |
|||||||||||||
|
Financial liabilities |
1,601.5 |
1,416.7 |
13.0 |
|||||||||||||
|
Net financial debt4 |
1,080.6 |
792.2 |
36.4 |
|||||||||||||
|
Capital expenditures (including financial assets) |
572.2 |
503.7 |
13.6 |
|||||||||||||
|
Depreciation (including financial assets) |
599.0 |
564.4 |
6.1 |
|||||||||||||
|
Net cash flow5 |
215.7 |
109.7 |
96.6 |
|||||||||||||
|
|
|
|
|
|||||||||||||
|
Research and Development |
|
|
|
|||||||||||||
|
Research and development expenses |
183.1 |
173.8 |
5.4 |
|||||||||||||
|
|
|
|
|
|||||||||||||
|
Employees |
|
|
|
|||||||||||||
|
Personnel expenses |
1,246.9 |
1,133.0 |
10.1 |
|||||||||||||
|
Employees (December 31, number) |
16,703 |
16,009 |
4.3 |
|||||||||||||
|
|
|
|
|
|||||||||||||
Vision
As an innovative chemical company, WACKER makes a vital contribution to improving the quality of life around the world.
In the future, we want to continue developing and supplying solutions that meet our rigorous demands – creating added value for our customers and shareholders, and growing sustainably.
Key Financial Indicators
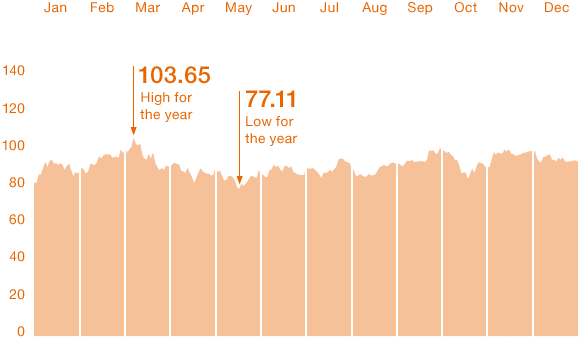
WACKER Share Performance (€)

Divisional Shares in Group Sales (%)

Earnings per Share (€)

EBITDA Margin (%)

Return on Capital Employed (ROCE) (%)