Net Assets
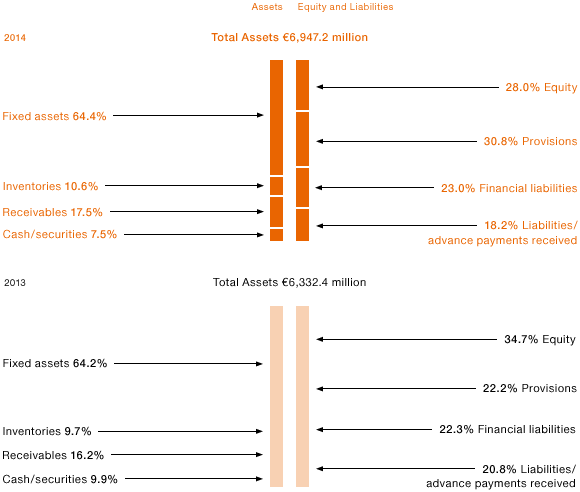
WACKER’s total assets were 10 percent higher compared with December 31, 2013. They rose by € 614.8 million to € 6.95 billion as of December 31, 2014 (Dec. 31, 2013: € 6.33 billion). There are several reasons for the substantial increase. During the reporting period, the appreciation of the US dollar and other currencies against the euro had a major impact on the Group’s assets and liabilities. Currency-translation effects increased the balance sheet total by € 297.3 million, especially in the categories of noncurrent assets, equity and financial liabilities. Full consolidation of Siltronic Silicon Wafer Pte. Ltd. and Scil Proteins Production GmbH, as well as construction-project progress on the polysilicon facility in Charleston, Tennessee (USA), added to property, plant and equipment. Loans that had been granted by WACKER to Siltronic Silicon Wafer Pte. Ltd. and were accounted for as financial assets are no longer included in the consolidated financial statements. Good operating performance led to both higher trade receivables and inventory levels. On the equity and liabilities side, the increase in financial liabilities was accompanied by a rise of € 678.9 million in provisions for pensions that was due to lower discount rates. This also reduced equity by € 520.2 million. For a detailed explanation of the effects of the initial consolidation of Siltronic Silicon Wafer Pte. Ltd., please see the section of the Notes to the consolidated financial statements.
Asset and Capital Structure

Combined Statement of Financial Position
| Download XLS |
|
|
|
|
||||
|
€ million |
2014 |
2013 |
Change in % |
|||
|
|
|
|
|
|||
|
Assets |
|
|
|
|||
|
Intangible assets, property, plant and equipment, and investment property |
4,345.7 |
3,806.0 |
14.2 |
|||
|
Investments in joint ventures and associates accounted for using the equity method |
20.5 |
18.9 |
8.5 |
|||
|
Other noncurrent assets |
487.9 |
562.2 |
-13.2 |
|||
|
Noncurrent assets |
4,854.1 |
4,387.1 |
10.6 |
|||
|
Inventories |
734.3 |
616.9 |
19.0 |
|||
|
Trade receivables |
684.0 |
614.1 |
11.4 |
|||
|
Other current assets |
674.8 |
714.3 |
-5.5 |
|||
|
Current assets |
2,093.1 |
1,945.3 |
7.6 |
|||
|
Total assets |
6,947.2 |
6,332.4 |
9.7 |
|||
|
|
|
|
|
|||
|
Equity and Liabilities |
|
|
|
|||
|
Equity |
1,946.5 |
2,197.1 |
-11.4 |
|||
|
Noncurrent provisions |
1,983.7 |
1,262.0 |
57.2 |
|||
|
Financial liabilities |
1,318.2 |
1,247.4 |
5.7 |
|||
|
Other noncurrent liabilities |
533.9 |
567.3 |
-5.9 |
|||
|
Of which advance payments received |
523.0 |
564.4 |
-7.3 |
|||
|
Noncurrent liabilities |
3,835.8 |
3,076.7 |
24.7 |
|||
|
Financial liabilities |
283.3 |
169.3 |
67.3 |
|||
|
Trade payables |
374.5 |
309.4 |
21.0 |
|||
|
Other current provisions and liabilities |
507.1 |
579.9 |
-12.6 |
|||
|
Current liabilities |
1,164.9 |
1,058.6 |
10.0 |
|||
|
Liabilities |
5,000.7 |
4,135.3 |
20.9 |
|||
|
Total equity and liabilities |
6,947.2 |
6,332.4 |
9.7 |
|||
|
Capital employed |
5,260.7 |
5,238.2 |
0.4 |
|||
|
|
|
|
|
|||