Cash Flow
Net Cash Flow
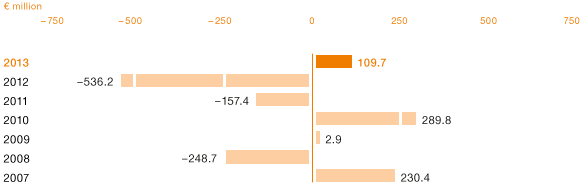
In 2013, WACKER complied with its long-term policy of essentially financing its investments from its own cash flow. Net cash flow totaled € 109.7 million in 2013 (2012: € – 536.2 million), demonstrating that long-term investments are predominantly covered by the cash flow from operating activities.
Net Cash Flow
| Download XLS |
|
|
|
|
||
|
€ million |
2013 |
2012 |
||
|
|
|
|
||
|
Cash flow from operating activities (gross cash flow) |
464.0 |
363.2 |
||
|
Changes in advance payments received |
200.9 |
154.4 |
||
|
Cash flow from long-term investing activities before securities |
-555.2 |
-1,053.8 |
||
|
Net cash flow |
109.7 |
-536.2 |
||
|
|
|
|
Net cash flow is the sum of cash flow from operating activities (excluding changes in advance payments) and cash flow from long-term investing activities (before securities), including additions due to finance leases.
Net Cash Flow

Financial liabilities amounted to € 1.42 billion as of December 31, 2013 (Dec. 31, 2012: € 1.20 billion), up € 219.5 million year on year. On April 23, 2013, WACKER issued US$ 400 million in senior unsecured notes in a private placement in the USA. The notes were offered with three maturities, namely five, seven and ten years. The transaction was based on standard market credit terms. It enabled WACKER to finance the expansion of its business operations in the USA by means of local-currency loans and to substantially reduce its exposure to currency risks.
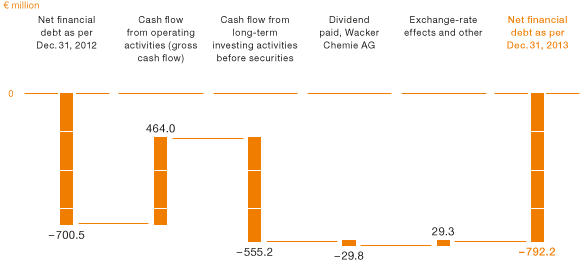
WACKER defines net financial debt – which is one of its financial indicators – as the balance of gross financial debt (current and noncurrent financial liabilities) and existing noncurrent and current liquidity, consisting of securities, cash and cash equivalents. In the period under review, net financial debt grew at a substantially slower rate than in 2012. The moderate rise of € 91.7 million to € 792.2 million (Dec. 31, 2012: € 700.5 million) was attributable to substantially reduced capital expenditures compared with the prior year. In 2013, WACKER invested € 503.7 million, which corresponds to an investment ratio of 11 percent (2012: 24 percent).
Aside from the financial liabilities disclosed in the report on net assets, WACKER has at its disposal adequate unused syndicated loans with terms of over one year totaling some € 700 million as of the reporting date. In 2013, WACKER entered into an agreement for an additional special loan of € 80 million from the European Investment Bank to finance research and development expenditures at Siltronic. Thus far, this loan has not been drawn down. In addition, new agreements were signed with Chinese banks to refinance existing loans. Our existing credit lines provide us with enough financial scope to secure the Group’s continued growth. The Group does not use any off-balance-sheet financing components.
Net Financial Debt

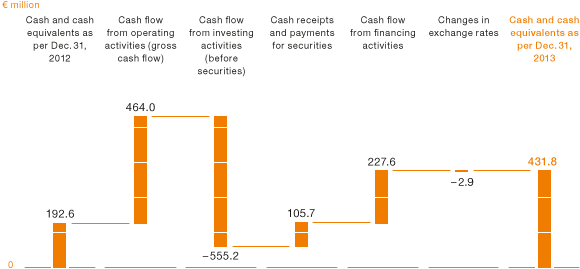
Trend in Cash and Cash Equivalents
Cash flow (with its components) shows the change in cash and cash equivalents in the period under review.
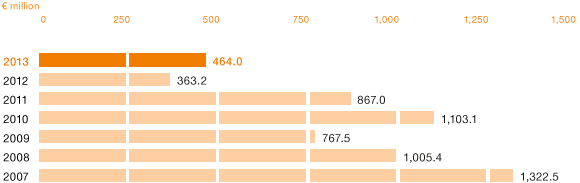
Gross Cash Flow
In 2013, cash inflows from operational activities (gross cash flow) amounted to € 464.0 million (2012: € 363.2 million), up 28 percent. Net income for the year dropped substantially year on year, amounting to € 6.3 million compared with € 114.7 million in 2012. This item, however, contained a large number of expenses that did not affect cash flow. Depreciation of € 564.4 million and changes in provisions amounting to € 47.3 million added to gross cash flow. The reduction in working capital (trade receivables less trade payables from operational activities plus inventories) was another positive impact, adding € 81.7 million to gross cash flow. As expected, advance payments received – relating mainly to future polysilicon deliveries – changed in 2013 by € – 200.9 million (2012: € – 154.4 million) in line with the deliveries made and the advance payments retained in connection with terminated contracts.
Cash Flow from Operating Activities (Gross Cash Flow)

Cash Flow from Investing Activities
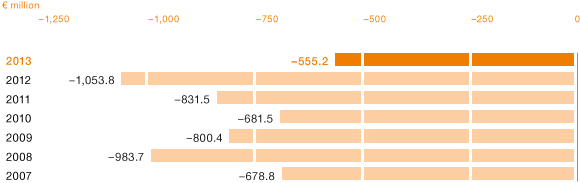
The Group’s investment projects influence cash flow from long-term investing activities. Extension of the timeline for constructing the production site in Charleston, Tennessee (USA) reduced the cash flow from long-term investing activities from € 1.05 billion in 2012 to € 555.2 million in 2013. Capital expenditures mainly concerned property, plant and equipment. In 2013, too, some 50 percent of capital expenditures related to the construction of the new US production site.
Cash Flow from Long-Term Investing Activities before Securities

In 2013, inflows and outflows of cash from securities with maturities exceeding three months were classified as cash flow from investing activities. Cash flow from investing activities totaled € 449.5 million (2012: € 970.4 million). Overall, maturing securities led to incoming payments during the reporting period.
Cash Flow from Financing Activities
In 2013, cash inflow from financing activities was € 227.6 million (2012: € 326.6 million) and mainly comprised the cash inflow from the private placement of US$ 400 million. In addition, bank debt in the amount of € 124.7 million was repaid. The dividend payment by Wacker Chemie AG in the second quarter of 2013 led to a cash outflow of € 29.8 million. Cash and cash equivalents grew by € 239.2 million year on year, amounting to € 431.8 million (2012: € 192.6 million).
Changes in Cash and Cash Equivalents