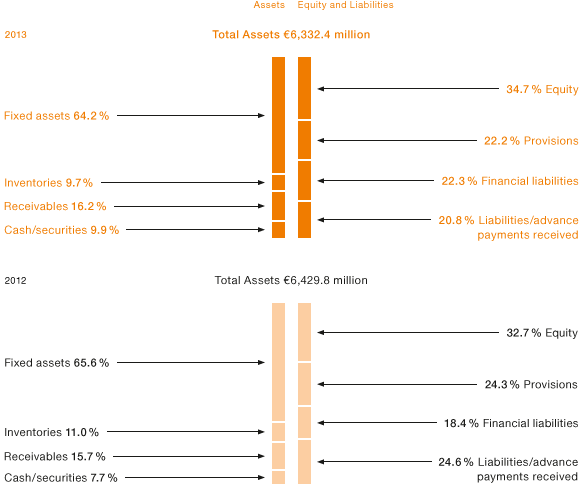
Net Assets
Between year-end 2012 and year-end 2013, total assets decreased by 2.5 percent or € 160.4 million to € 6.33 billion (Dec. 31, 2012: € 6.49 billion), mainly because of lower noncurrent assets and a reduction in working capital compared with the prior year. The provisions for pensions recognized by WACKER at the balance sheet date were lower due to remeasurement effects, falling by € 156.2 million. In contrast, the senior unsecured notes placed in the USA in Q1 2013 increased total assets by US$ 400 million, raising both liquidity and financial liabilities. Liquidity was reduced by cash outflows for capital expenditures, the dividend payout and the redemption of bank loans falling due. Foreign currency translation effects reduced total assets by € 104.2 million.
The prior-year figures for equity and liabilities given here differ markedly from those published by WACKER in the 2012 quarterly reports and annual report. This is because of the adoption of the new IAS 19 (revised) accounting standard “Employee Benefits,” which led to a substantial rise in pension provisions. At the same time, equity was reduced. The changes are presented in detail in the Notes section under “Changes in Accounting and Valuation Methods”.
Asset and Capital Structure

Asset and Capital Structure
| Download XLS |
|
|
|
|
||||||
|
€ million |
2013 |
2012* |
Change in % |
|||||
|
|
|
|
|
|||||
|
||||||||
|
Assets |
|
|
|
|||||
|
Intangible assets, property, plant and equipment, and investment property |
3,806.0 |
3,949.9 |
-3.6 |
|||||
|
Investments in joint ventures and associates accounted for using the equity method |
18.9 |
41.0 |
-53.9 |
|||||
|
Other noncurrent assets |
562.2 |
544.7 |
3.2 |
|||||
|
Noncurrent assets |
4,387.1 |
4,535.6 |
-3.3 |
|||||
|
Inventories |
616.9 |
712.1 |
-13.4 |
|||||
|
Trade receivables |
614.1 |
600.2 |
2.3 |
|||||
|
Other current assets |
714.3 |
644.9 |
10.8 |
|||||
|
Current assets |
1,945.3 |
1,957.2 |
-0.6 |
|||||
|
Total assets |
6,332.4 |
6,492.8 |
-2.5 |
|||||
|
|
|
|
|
|||||
|
Equity and liabilities |
|
|
|
|||||
|
Equity |
2,197.1 |
2,121.3 |
3.6 |
|||||
|
Noncurrent provisions |
1,262.0 |
1,432.3 |
-11.9 |
|||||
|
Financial liabilities |
1,247.4 |
958.5 |
30.1 |
|||||
|
Other noncurrent liabilities |
567.3 |
819.4 |
-30.8 |
|||||
|
of which advance payments received |
564.4 |
803.4 |
-29.7 |
|||||
|
Noncurrent liabilities |
3,076.7 |
3,210.2 |
-4.2 |
|||||
|
Financial liabilities |
169.3 |
238.7 |
-29.1 |
|||||
|
Trade payables |
309.4 |
379.8 |
-18.5 |
|||||
|
Other current provisions and liabilities |
579.9 |
542.8 |
6.8 |
|||||
|
Current liabilities |
1,058.6 |
1,161.3 |
-8.8 |
|||||
|
Liabilities |
4,135.3 |
4,371.5 |
-5.4 |
|||||
|
Total equity and liabilities |
6,332.4 |
6,492.8 |
-2.5 |
|||||
|
Capital employed |
5,238.2 |
4,979.0 |
5.2 |
|||||
|
|
|
|
|
|||||