WACKER at a Glance
| Download XLS |
|
|
|
|
|||||||||||||||||
|
€ million |
2013 |
2012* |
Change in % |
||||||||||||||||
|
|
|
|
|
||||||||||||||||
|
|||||||||||||||||||
|
Results / Return |
|
|
|
||||||||||||||||
|
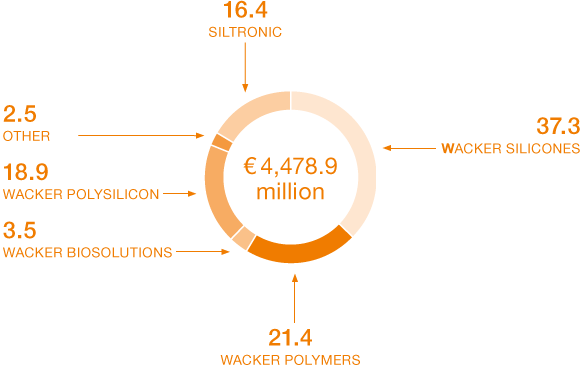
Sales |
4,478.9 |
4,634.9 |
-3.4 |
||||||||||||||||
|
678.7 |
795.4 |
-14.7 |
|||||||||||||||||
|
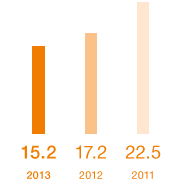
EBITDA margin2 (%) |
15.2 |
17.2 |
n. a. |
||||||||||||||||
|
EBIT3 |
114.3 |
266.6 |
-57.1 |
||||||||||||||||
|
EBIT margin2 (%) |
2.6 |
5.8 |
n. a. |
||||||||||||||||
|
|
|
|
|
||||||||||||||||
|
Financial result |
– 83.3 |
-62.7 |
32.9 |
||||||||||||||||
|
Income before taxes |
31.0 |
203.9 |
-84.8 |
||||||||||||||||
|
Net income for the year |
6.3 |
114.7 |
-94.5 |
||||||||||||||||
|
|
|
|
|
||||||||||||||||
|
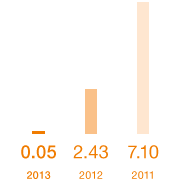
Earnings per share (basic / diluted) (€) |
0.05 |
2.43 |
-97.9 |
||||||||||||||||
|
ROCE (%) |
2.2 |
5.2 |
n. a. |
||||||||||||||||
|
|
|
|
|
||||||||||||||||
|
Financial Position / Cash Flows |
|
|
|
||||||||||||||||
|
Total assets |
6,332.4 |
6,492.8 |
-2.5 |
||||||||||||||||
|
Equity |
2,197.1 |
2,121.3 |
3.6 |
||||||||||||||||
|
Equity ratio (%) |
34.7 |
32.7 |
n. a. |
||||||||||||||||
|
Financial liabilities |
1,416.7 |
1,197.2 |
18.3 |
||||||||||||||||
|
Net financial debt4 |
792.2 |
700.5 |
13.1 |
||||||||||||||||
|
Capital expenditures (including financial assets) |
503.7 |
1,095.4 |
-54.0 |
||||||||||||||||
|
Depreciation (including financial assets) |
564.4 |
528.8 |
6.7 |
||||||||||||||||
|
Net cash flow5 |
109.7 |
-536.2 |
n. a. |
||||||||||||||||
|
|
|
|
|
||||||||||||||||
|
Research and Development |
|
|
|
||||||||||||||||
|
Research and development expenses |
173.8 |
173.7 |
0.1 |
||||||||||||||||
|
|
|
|
|
||||||||||||||||
|
Employees |
|
|
|
||||||||||||||||
|
Personnel expenses |
1,133.0 |
1,196.8 |
-5.3 |
||||||||||||||||
|
Employees (December 31, number) |
16,009 |
16,292 |
-1.7 |
||||||||||||||||
|
|
|
|
|
||||||||||||||||
Vision
WACKER, as an innovative chemical company, makes a vital contribution to improving the quality of life around the world. In the future, we want to continue developing and supplying solutions that meet our rigorous demands – creating added value for our customers and shareholders, and growing sustainably.
Key Financial Indicators
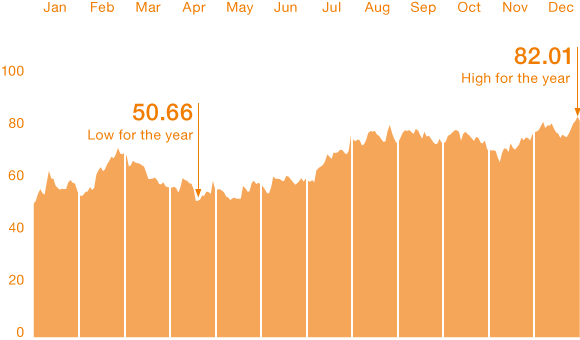
WACKER Share Performance (€)

Divisional Shares in Group Sales (%)

|
  |
  |
Return on Capital Employed (ROCE) (%) 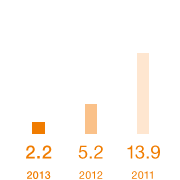  |