Sustainability
Managing Sustainability
Companies can only be profitable in the long term if they take their responsibility toward the environment and society seriously. That is why sustainability has been firmly rooted in our business processes for many years. The importance of sustainability to us is demonstrated by the fact that we have made it one of our five strategic goals and have compiled our own Code of Sustainability. Sustainable development means balancing economic, ecological and social factors in everything we do.
Two voluntary global initiatives form the basis for sustainable corporate management at WACKER: Responsible Care® (the chemical-industry initiative) and the UN’s Global Compact. Through this voluntary commitment, WACKER undertakes to protect the environment, employees and society above and beyond legal requirements. We also expect our suppliers to respect the principles of the UN’s Global Compact and the Responsible Care® initiative. This is part of our general terms of procurement.
WACKER Greater China won the Responsible Care® Chairman’s Award in 2013. With this award, the Association of International Chemical Manufacturers in China acknowledged WACKER’s endeavors in environmental and health protection, as well as in plant and workplace safety.
Substantial progress was made on strategic sustainability-management projects in 2013:
- Group Certificate
Our Group certification ensures that customer-driven specifications and our corporate standards are implemented at all WACKER sites. In 2013, we expanded our Group certification to include our Jincheon site in South Korea (certified to ISO 9001 and ISO 14001) and other sales regions (certified to ISO 9001). Jincheon additionally has local OHSAS 18001 certification. The German sites have introduced an OHSAS 18001 management system. We have merged Wacker Chemie AG’s ISO 14001 certification with that of Siltronic AG.
Almost all WACKER production sites are now included in the Group certificate. Not yet included are the sites in Brazil and India, which have corresponding individual certificates, though. The Jandira site in Brazil also passed an external OHSAS 18001 audit in 2013.
- Energy Management
Our energy goals ensure we meet a requirement for ISO 50001 certification of WACKER Germany. We already had the energy management systems at Wacker Chemie AG and Siltronic certified to this standard in 2012. This was followed in 2013 by the certification of Alzwerke GmbH, whose primary purpose is to generate hydroelectric power.
- Greenhouse Gas Emissions
After having determined our indirect greenhouse gas emissions from bought-in energy (as per Greenhouse Gas Protocol Scope 2) for the first time in 2011, we started measuring our Scope 3 emissions in 2013. These include all emissions generated along the supply chain, e.g. by suppliers or through waste disposal and the transportation of products. The Group’s carbon footprint is an important tool for improving climate protection.
- Lifecycle Assessments
We have developed an analytical tool that enables us to estimate, already in the R&D phase, the environmental impact of new products. Launched in 2012, the environmental analysis performed with the Eco Assessment Tool is gradually being established within the Group. It helps us to assess and improve the sustainability of our products.
- Sustainability Platform
In the year under review, we implemented groupwide our new IT system for sustainability reporting (SPIRIT), replacing the various individual systems. We use the new software to collect and manage environmental and energy data, environment- and safety-related incidents and Integrated Management System (IMS) audits.
Sustainability Report
In 2013, WACKER published its new Sustainability Report for 2011/2012. The report adheres completely to the G3 guidelines set by the Global Reporting Initiative (GRI). GRI evaluated the report and accorded it an A, their highest report grade. Partly in the interests of environmental protection, this was the first time that the company’s report had been published exclusively as an online version. With its new Sustainability Report, WACKER provides a full and transparent account of its sustainability efforts to customers, business partners, employees, shareholders, analysts, non-governmental organizations, regulatory bodies and the neighbors of its various sites.
Compliance Officers Advising Employees Worldwide
WACKER’s ethical principles of corporate management exceed legal requirements. Employees can direct their questions to 22 compliance officers worldwide. They are based in Germany, the USA, China, Taiwan, Japan, India, South Korea, Brazil, Mexico, Singapore and the United Arab Emirates. Compliance issues in countries other than those listed are handled in Germany by the corporate Compliance Officer.
Employees are instructed to inform their supervisors, the compliance officers, the employee council or their designated HR contacts of any violations they notice. In 2013, Compliance Management continued to focus on devising and implementing globally applicable measures in consultation with international sites to ensure compliance with local requirements.
Environmental Protection
All WACKER’s processes focus on the need to protect the environment and to manufacture products safely. We attach particular importance to integrated environmental protection. This commences with product development and plant planning. In accordance with the core ideas of the Responsible Care® initiative, our environmental protection measures often go beyond what is legally required. In 2013, WACKER invested € 5.4 million in environmental protection (2012: € 8.6 million). In the same period environmental operating costs amounted to € 89.4 million (2012: € 79.3 million). WACKER continuously works on improving its production processes to conserve resources. One of our main tasks is to close material loops and recycle byproducts from other areas back into production, enabling us to reduce or prevent emissions and waste. We only have access to partial benchmark figures on how the chemical industry recycles, or disposes of, hazardous chemical waste because of the industry’s product-mix variations and unique site infrastructures.
In 2013, we achieved a slight reduction in direct emissions of carbon dioxide and nitrogen oxides thanks to improvements made to the Burghausen power plant. Lower exterior temperatures during the year under review resulted in reduced water use at Burghausen. We have closed the Burghausen acetaldehyde plant, and this has lowered chemical oxygen demand and emissions of halogenated organic compounds into our wastewater. The total waste volume rose slightly, owing to more filter and sewage sludge resulting from additional capacity utilization at the Nünchritz site, which also saw the disposal of construction waste from the expansion measures. In Burghausen, more chlorosilane was eliminated by incineration of residues. The resulting silicic acid was provided to the cement industry for their further use.
Since fiscal 2011, our environmental indicators include our silicon-metal plant in Holla (Norway), acquired in 2010. The environmental impact of metallurgical production there differs greatly from that of WACKER’s typical chemical operations. The environmental indicators, particularly regarding airborne emissions, have risen as a result of the acquisition. Groupwide, WACKER emitted a total of 1,236,000 metric tons of carbon dioxide in 2013 (2012: 1,294,000 metric tons CO2). Lower emissions in 2013 are the result of improved power plant operations and the planned decommissioning of a gas turbine at the Burghausen site. Carbon dioxide makes up 98.5 percent of WACKER’s direct greenhouse gas emissions. The remaining 1.5 percent is made up of nitrous oxide, methane, fluorocarbons and other greenhouse gases.
Emissions into the Air: Business Divisions/Metallurgy
| Download XLS |
|
|
||||||||||||||||
|
|
2013 Groupwide |
2012 Groupwide |
2013 Business divisions1 |
2012 Business divisions1 |
2013 Metallurgical production2 |
2012 Metallurgical production2 |
||||||||||
|
|
|
|
|
|
|
|
||||||||||
|
||||||||||||||||
|
Air |
|
|
|
|
|
|
||||||||||
|
CO2 emissions (kt) |
1,236 |
1,294 |
925 |
983 |
311 |
310 |
||||||||||
|
NOX nitrogen oxides (t) |
2,130 |
2,225 |
950 |
1,072 |
1,180 |
1,153 |
||||||||||
|
Non-methane volatile organic compounds (NMVOCs) (t) |
410 |
418 |
403 |
411 |
7 |
7 |
||||||||||
Our indirect greenhouse gas emissions from procured energy (as per Greenhouse Gas Protocol Scope 2) rose by 9.5 percent in 2013. The increase in Scope 2 emissions is caused not only by increased production capacity for polysilicon at the Nünchritz site, but also by a shift from Scope 1 to Scope 2 emissions due to the planned shutdown of a gas turbine at the Burghausen site. In addition, one-fourth of the increase is caused by the annual update of regional emission factors used in calculating greenhouse gas emissions.
The Group’s carbon footprint is an important tool for improving climate protection. After determining our indirect greenhouse gas emissions from bought-in energy (as per Greenhouse Gas Protocol Scope 2) for the first time in 2011, we have also been measuring our Scope 3 emissions since 2012. These include all emissions generated along the supply chain, e.g. by suppliers or through waste disposal and the transportation of products. In the 2013 fiscal year, we once again forwarded these emissions data to the Carbon Disclosure Project (CDP), which WACKER joined in 2007. Founded in London in 2000, CDP is a not-for-profit organization working to achieve greater transparency in greenhouse gas emissions.
Since the fall of 2013, we have been participants in the myccf project of co2ncept plus – a German association of businesses with interests in emissions trading and climate protection issues. In this project, which is supported by the German Federal Environmental Foundation (DBU), we determine our corporate carbon footprint (CCF). We use the resulting data to further optimize our energy management and to improve climate-related environmental protection measures.
Environmental Indicators from 2007 to 20131
| Download XLS |
|
|
|
|
||||||||||||||||||||||||
|
|
2013 |
2012 |
2011 |
2010 |
2009 |
2008 |
2007 |
|||||||||||||||||||
|
|
|
|
|
|
|
|
|
|||||||||||||||||||
|
||||||||||||||||||||||||||
|
Air |
|
|
|
|
|
|
|
|||||||||||||||||||
|
CO2 emissions2 (kt) |
1,236 |
1,294 |
1,341 |
986 |
969 |
976 |
912 |
|||||||||||||||||||
|
NOx nitrogen oxides (t) |
2,130 |
2,225 |
2,221 |
926 |
963 |
997 |
838 |
|||||||||||||||||||
|
Non-methane volatile organic compounds (NMVOCs) (t) |
410 |
418 |
396 |
415 |
383 |
501 |
687 |
|||||||||||||||||||
|
Greenhouse gases |
|
|
|
|
|
|
|
|||||||||||||||||||
|
direct3 (kt CO2) |
1,236 |
1,294 |
1,341 |
– |
– |
– |
– |
|||||||||||||||||||
|
indirect4 (kt CO2) |
1,247 |
1,138 |
1,075 |
– |
– |
– |
– |
|||||||||||||||||||
|
|
|
|
|
|
|
|
|
|||||||||||||||||||
|
Water |
|
|
|
|
|
|
|
|||||||||||||||||||
|
Water consumption5 (thousand m3) |
220,908 |
242,072 |
268,657 |
252,151 |
264,532 |
241,286 |
244,173 |
|||||||||||||||||||
|
Chemical oxygen demand (COD) (t) |
1,320 |
1,460 |
1,680 |
1,820 |
2,730 |
4,782 |
2,162 |
|||||||||||||||||||
|
Halogenated organic hydrocarbons (AOX) (t) |
2 |
3 |
5 |
6 |
6 |
7 |
6 |
|||||||||||||||||||
|
|
|
|
|
|
|
|
|
|||||||||||||||||||
|
Waste |
|
|
|
|
|
|
|
|||||||||||||||||||
|
Disposed of (t) |
31,560 |
39,920 |
47,410 |
48,520 |
80,860 |
87,293 |
43,100 |
|||||||||||||||||||
|
Recycled (t) |
110,500 |
96,880 |
80,290 |
77,030 |
63,430 |
74,327 |
74,676 |
|||||||||||||||||||
|
Hazardous (t) |
73,380 |
73,620 |
68,230 |
69,320 |
100,860 |
108,458 |
70,027 |
|||||||||||||||||||
|
Non-hazardous (t) |
68,680 |
63,180 |
59,470 |
56,230 |
43,430 |
53,161 |
47,538 |
|||||||||||||||||||
|
|
|
|
|
|
|
|
|
|||||||||||||||||||
|
Energy |
|
|
|
|
|
|
|
|||||||||||||||||||
|
Electricity consumption (GWh) |
4,526 |
4,559 |
4,372 |
3,759 |
2,702 |
2,405 |
2,107 |
|||||||||||||||||||
|
Primary energy consumption natural gas (GWh) |
5,051 |
5,927 |
5,771 |
5,463 |
5,378 |
5,372 |
– |
|||||||||||||||||||
|
Solid fuels6 (coal, charcoal, wood) (GWh) |
872 |
862 |
886 |
432 |
– |
– |
– |
|||||||||||||||||||
|
Heat supplied by third parties (steam and district heating) (GWh) |
236 |
223 |
218 |
228 |
209 |
195 |
– |
|||||||||||||||||||
|
Heating oil (GWh) |
17 |
18 |
16 |
13 |
8 |
9 |
– |
|||||||||||||||||||
|
|
|
|
|
|
|
|
|
|||||||||||||||||||
In the case of wastewater, chemical oxygen demand and halogenated organic compounds were both down because we closed the Burghausen acetaldehyde plant in 2012. Disposable waste has been reduced, since the filter cake from wastewater treatment at Burghausen is now being recycled instead of being disposed of as before.
Water Consumption Tested Using the Global Water Tool ©
In many parts of the world, clean water is particularly scarce, and thus obtaining and purifying water is very expensive there. As a globally-active company, we take such conditions into account in our production processes and during transport. We used the Global Water Tool © (GWT) developed by the World Business Council for Sustainable Development (WBCSD) to analyze the annual relative water stress index of the countries in which our main global production sites are located.
This analysis was conducted for the first time in 2012, based on analyses using the water stress index developed by the Water Systems Analysis Group of the University of New Hampshire, USA. This index provides information on the relationship between water consumption and the availability of renewable fresh water. The outcome of the analysis is that our most important production sites are located in regions with a low relative water stress index. These regions account for more than 97 percent of our annual water consumption and over 90 percent of our production volume. Production sites in countries for which no GWT-based water stress index information is available account for less than 0.5 percent of our water consumption.
“Save Wastewater and Make a Profit” was the title of a special Employee Suggestion Program initiative launched in July 2013 at the Burghausen site. The goal was to encourage employees to scrutinize any and all parameters relevant for water consumption and recycling in production. When the campaign ended on December 31, 2013, employees had submitted 72 improvement suggestions, with 5 of them implemented by year’s end. Another 30 suggestions were set aside as potential future wastewater treatment projects; examples include sewer-system modifications and retention systems for rainwater.
Product Stewardship
WACKER takes criteria for environmental and health protection as well as for safety into account at every stage of the product lifecycle. In research and development projects, we examine the sustainability aspects of our new products and processes, starting with the raw materials used. We try to minimize raw-material consumption while selecting materials that offer maximum ecological benefit.
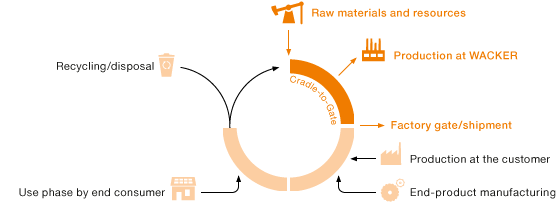
Our products are generally supplied to business customers for further processing – not directly to end customers. Our lifecycle assessments (LCA s) look at the environmental impact caused by a specific product family throughout its lifecycle – a “cradle-to-gate” assessment extending from manufacturing to the factory gate. They allow us to gauge the sustainability of our products and production processes, and to improve them accordingly.
Product Lifecycles

We have introduced a tool to systematically evaluate the risks and opportunities of our product line from an environmental perspective – starting at the development phase and continuing with feedback from our customers. This WACKER® Eco Assessment Tool factors in the material, water and energy consumption of a product, as well as its ecotoxicity, over the entire life cycle. We have already used it to assess initial product families and we will be widening its scope to include other products.
Energy Management
The chemical industry is an extremely energy-intensive sector. In Germany alone, it uses around 20 percent of all the power consumed by industry. WACKER is therefore also continually improving the energy efficiency of its processes. This enables us to remain globally competitive and to support climate protection. Many chemical reactions generate heat that can be put to use in other production processes. We have been using integrated heat-recovery systems in Burghausen and Nünchritz for years and are continually improving them. In this way, we can reduce the amount of primary energy (as a rule, natural gas) that our power plants consume.
To further improve energy efficiency and reduce specific energy consumption (amount of energy per unit of net production output), the Executive Board has defined energy targets for WACKER Germany. We already cut specific energy consumption by 22 percent between 2007 and 2013. This should drop a further 11 percent between 2014 and 2022. Overall, by 2022, we will have brought our specific energy consumption down by one-third.
One new tool used by our energy managers is the “energy cascade”, in which computer simulations are used to compare the current energy consumption of production plants with the theoretical optimum, and to identify the sources of energy losses. In 2013, we used it to determine potential electricity and heat savings for our methylchlorosilane (MCS) synthesis facility at the Nünchritz site.
Generating Energy Efficiently
Burghausen uses hydroelectric power to generate electricity. Our Norwegian site, Holla, also generates its electricity mainly from water power. Our primary source of energy, though, is climate-friendly natural gas. At WACKER’s large Burghausen and Nünchritz sites, we produce steam and electricity in cogeneration systems. These combined heat and power (CHP) plants have more than 80-percent fuel efficiency, which is significantly higher than that of conventional plants, where electricity and heat are generated separately.
Electricity Supply

1 Burghausen / Nünchritz
2 Burghausen
3 Coal, lignite, oil, gas
4 Hydro, wind, solar power
5 Outside Germany, we purchase electricity from third parties based on the local standard energy mix
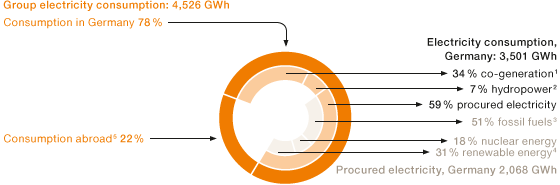
In 2013, electricity consumption fell slightly to 4.5 million MWh (2012: 4.6 million MWh). This was caused by the lower utilization of our polysilicon production capacity at the beginning of the year. The Group’s power plants – the hydroelectric and CHP (gas and steam turbine) generating stations in Burghausen and the CHP in Nünchritz – produced around 1.5 million MWh in 2013 (2012: 1.6 million MWh). This means that WACKER covered about a third of its total electricity needs with its own production. Groupwide, carbon dioxide emissions – of which around 90 percent in 2013 (2012: 60 percent) result from captive power plants subject to emissions trading rules and from silicon-metal production in Holla, Norway – totaled about 1.2 million metric tons in the period under review (2012: 1.3 million metric tons). Procurement of emission allowances have been included in energy procurement planning since 2013. Having achieved a surplus in the second trading period (2008 through 2012), we did not have to purchase additional emission allowances for 2013.
WACKER’s German production sites accounted for 78 percent (2012: 76 percent) of its electricity needs. In Germany, we purchased enough electricity from utilities to cover 59 percent of our electricity requirements there (2012: 55 percent). In line with the utilities’ primary energy sources, 51 percent of this electricity was generated from fossil fuels (2012: 60 percent). 18 percent came from nuclear energy (2012: 24 percent) and 31 percent from renewable energy sources (2012: 16 percent). Heat consumption, which includes the use of solid carbon-based and biogenic fuels (coal, charcoal, wood) in silicon-metal production at Holla (Norway), fell slightly across the Group to 3,724 GWh (2012: 3,755 GWh). Consumption of natural gas decreased due to the planned shutdown of a gas turbine at the Burghausen site and to lower hydrogen production compared to the prior-year figure.
Energy Consumption
| Download XLS |
|
|
|
|
||||||||||||||||
|
GWh |
2013 |
2012 |
2011 |
2010 |
2009 |
2008 |
2007 |
|||||||||||
|
|
|
|
|
|
|
|
|
|||||||||||
|
||||||||||||||||||
|
Energy consumption |
4,526 |
4,559 |
4,372 |
3,759 |
2,702 |
2,405 |
2,107 |
|||||||||||
|
Heat consumption1 |
3,724 |
3,755 |
3,862 |
3,374 |
2,794 |
2,782 |
2,516 |
|||||||||||
|
|
|
|
|
|
|
|
|
|||||||||||
|
Primary energy |
|
|
|
|
|
|
|
|||||||||||
|
Natural gas |
5,051 |
5,927 |
5,771 |
5,463 |
5,378 |
5,372 |
– |
|||||||||||
|
Solid fuels2 (coal, charcoal, wood) |
872 |
862 |
886 |
432 |
– |
– |
– |
|||||||||||
|
Heat supplied by third parties (steam and district heating) |
236 |
223 |
218 |
228 |
209 |
195 |
– |
|||||||||||
|
Fuel oil |
17 |
18 |
16 |
13 |
8 |
9 |
– |
|||||||||||
|
|
|
|
|
|
|
|
|
|||||||||||
Workplace and Plant-Safety Projects
Managing plants and processes in a way that poses no risk to people or the environment is an important objective at WACKER. We therefore operate a groupwide safety management system that covers both workplace safety and plant safety. Our processes and workplace safety standards will be aligned with the international standard OHSAS 18001 by 2015.
Systematic workplace safety includes the regular evaluation of hazards and work-area monitoring. The first step in ensuring plant safety is to identify the risks systematically and then assess them. This includes analyzing how well we control the energy (e.g. pressure, heat) present in a process and determining what influence an individual error might have on a chain of events that could lead to the escape of a substance or an accident. On completion of this comprehensive analysis, we specify safety measures that will prevent undesirable incidents.
We continued the ANSIKO project for machine safety in the year under review. At the German sites and at the SILMIX® plant in Plzěn (Czech Republic), we identified machinery that poses a risk of injury, subjected their safety plans to critical review and made them even safer to protect employees.
WACKER attaches particular importance to providing ongoing training to its safety experts. We hold regular training sessions, for example, on plant safety and explosion damage protection. Group experts organize safety training at WACKER sites, including those outside Germany. In 2013, we conducted safety reviews internationally at Holla (Norway) and in Brazil, and at the Nünchritz, Freiberg, Cologne and Jena sites in Germany.
Groupwide, there were 3.8 workplace accidents with missed workdays per 1 million hours worked in 2013 (2012: 4.7 accidents), a reduction of 19 percent from the previous year. In terms of reportable accidents (accidents with more than three days of absence), WACKER’s numbers are far better than the German chemical industry average. The reportable accident rate in 2013 was 1.4 per 1 million hours worked (2012: 2.1), whereas in 2012, Germany’s BG RCI (the statutory employer liability insurance carrier of the basic materials and chemical industries) registered 9.5 reportable accidents per 1 million hours worked in chemical companies.
Very few of the accidents at our sites are chemical in nature. The most common causes are tripping, slipping, falling, and inattentiveness during manual activities. Not satisfied with our accident rate, we are increasing our occupational-safety efforts. We are systematically implementing our new WACKER Safety Plus (WSP) program, which incorporates successful safety elements from sites with particularly low accident rates. Such elements include safety patrols, discussions with the workforce and emergency drills. WACKER Safety Plus has the goal of recognizing and avoiding unsafe behavior – on the way to and from work, in the office, at the plant, when operating machinery, or when handling chemicals. Our US subsidiary Wacker Chemical Corporation began introducing some of the key elements of the new safety program at US sites in 2013.
At German sites, WACKER published a safety manual for partner companies. It covers requirements and processes for working with partner companies and aims to ensure that planning, investment and repair projects are carried out safely and accident-free.
Workplace Accidents Involving Permanent Staff and Temporary Workers
| Download XLS |
|
|
|
|
||||||||||||||||
|
Number |
2013 |
2012 |
2011 |
2010 |
2009 |
2008 |
2007 |
|||||||||||
|
|
|
|
|
|
|
|
|
|||||||||||
|
||||||||||||||||||
|
Accident rate for Group employees: accidents1 per 1 million hours worked |
3.8 |
4.7 |
3.9 |
4.3 |
4.0 |
3.7 |
3.8 |
|||||||||||
|
Accident rate for Group employees: reportable accidents2 per 1 million hours worked |
1.4 |
2.1 |
1.4 |
1.2 |
1.2 |
1.0 |
1.4 |
|||||||||||
|
|
|
|
|
|
|
|
|
|||||||||||
Few Deficiencies in Hazardous Goods Transportation
WACKER ensures that its products are safely stored and transported. Before loading vehicles, we carry out stringent checks on them, especially if they are carrying hazardous goods. We inspected nearly 8,500 trucks in 2013. If a vehicle fails inspection, we continue sending it back until it passes. Failure rates have been low for years now. In 2013, the failure rate for shipments of hazardous goods in Germany dropped to 1.2 percent (2012: 2.2 percent). WACKER normally audits hazardous-goods shippers every two years.
We rely on well-trained personnel for transport safety as well. In 2013, we instructed over 1,300 employees throughout the Group in classroom seminars on the transport of hazardous goods. Another 1,750 completed an online training course.
We regularly review aspects of transport safety with our logistics providers, e.g. during the annual Logistics Day. If deficiencies are found, we agree on improvements and then follow up on their implementation. WACKER uses in-house criteria and internationally recognized systems, such as the Safety and Quality Assessment System (SQAS) operated by the European Chemical Industry Council (Cefic), to select logistics service providers and evaluate their performance. Our evaluation criteria include drivers’ qualifications and training, vehicle equipment and accident response. Through the use of standards and specifications, WACKER ensures that even the subcontractors working for our logistics providers meet our stringent safety requirements.
In 2013, we recorded eight transport incidents (2012: ten). This number includes not only accidents involving the distribution of our intermediates and products where we commissioned the transport, but also incidents not involving hazardous goods, whether or not they adversely impact people or the environment. These incidents, too, form part of our shipper assessments.
Transport Accidents
| Download XLS |
|
|
|
|
||||||||||||||
|
Number of Accidents |
2013 |
2012 |
2011 |
2010 |
2009 |
20081 |
20071 |
|||||||||
|
|
|
|
|
|
|
|
|
|||||||||
|
||||||||||||||||
|
Road |
4 |
8 |
6 |
4 |
5 |
11 |
– |
|||||||||
|
Rail |
1 |
2 |
1 |
1 |
– |
4 |
– |
|||||||||
|
Sea |
2 |
– |
1 |
– |
– |
2 |
– |
|||||||||
|
Inland waterways |
1 |
– |
– |
– |
– |
– |
– |
|||||||||
|
Air |
– |
– |
– |
– |
– |
– |
– |
|||||||||
|
|
|
|
|
|
|
|
|
|||||||||
WACKER Promotes Science Education and Social Projects
Companies can be commercially successful only if they have society’s trust. which is why we take our social responsibilities seriously, especially in communities near our sites. We place particular importance on the scientific and technical education of young people, as we will need committed chemists, engineers and laboratory assistants in the future if we are to remain competitive.
WACKER officially presented its new 2013 edition of the CHEM2DO experiment kit to the Bavarian State Ministry for Education and Culture. CHEM2DO gives students an opportunity to explore modern silicones and cyclodextrins. The experiments can be adapted to the varied curricula of the German secondary school system. Interested teachers can receive training on the materials throughout Germany. The course is offered at the teacher-training centers of the Society of German Chemists (GDCh) and at select universities. By late 2013, some 850 teachers nationwide, and more than 100 teachers in Austria, had completed the course. In the year under review, WACKER once again sponsored the Dresden/East Saxony regional heat of “Young Scientists.”
Employees Helping Colleagues
We attach particular importance to projects that help children and young people. Since 2007, WACKER has supported “Die Arche” (The Ark), a German Christian charity that aids children and adolescents from socially disadvantaged families in several German cities. In the reporting year, WACKER presented its seventh annual donation of € 100,000 to the charity’s Munich branch.
In June 2013, Germany experienced devastating floods that caused economic damage totaling several billion euros. Several WACKER employees, as well as social institutions in the German states of Saxony and Bavaria, as well as in Austria, were affected by the flooding. WACKER HILFSFONDS, our disaster-relief foundation, appealed for employee donations to help colleagues in distress. Employees responded in numbers and, by the end of 2013, had donated approximately € 52,000. Combined with an employer contribution, a total of € 152,000 in donations was collected and will shortly be distributed to those affected.