Earnings
The WACKER Group was able to substantially increase its sales and earnings in 2014. Driven by strong customer demand, sales grew by almost 8 percent. Despite the flat economy in the second half of the year, all our business divisions managed to sell higher volumes and to expand their sales year on year. Continuing growth of the photovoltaic market and higher polysilicon prices compared with 2013 had a positive impact on WACKER POLYSILICON’s sales and earnings. The amicable agreement reached with the Chinese Ministry of Commerce (MOFCOM) regarding the export to China of polysilicon produced in Europe was of special significance for WACKER’s business performance. Under the agreement, WACKER undertakes not to sell polysilicon below a specific minimum price that is based on standard market prices. In return, MOFCOM will refrain from imposing anti-dumping and anti-subsidy tariffs on WACKER’s polysilicon. Sales growth was impeded by negative exchange-rate effects. In 2014, Siltronic consolidated Siltronic Silicon Wafer Pte. Ltd. (SSW) for the first time, which had a positive impact on the division’s sales and EBITDA. The Group achieved a substantial year-on-year increase in EBITDA, which came in at € 1,042.3 million (2013: € 678.7 million). Non-recurring effects were another factor in this strong rise on the previous year. Net income for the year amounted to € 195.4 million, substantially higher than a year earlier (€ 6.3 million).
Group Sales of € 4.83 Billion Almost 8 Percent Higher Year on Year
In 2014, WACKER’s sales reached € 4.83 billion (2013: € 4.48 billion), up almost 8 percent year on year. This rise was largely attributable to slightly higher volumes and better prices for polysilicon. The Group’s chemical divisions benefited from volume gains and slightly improved prices as well.
The chemical divisions generated sales of € 2.97 billion (2013: € 2.81 billion), up 6 percent year on year. WACKER SILICONES, the company’s biggest business division, increased its sales to € 1.73 billion (2013: € 1.67 billion), almost 4 percent more than a year earlier. The rise was mainly the result of higher volumes. WACKER POLYMERS lifted its sales by almost 9 percent to € 1.06 billion (2013: € 978.7 million), with both dispersions and dispersible polymer powders contributing to this growth. WACKER BIOSOLUTIONS achieved sales of € 176.2 million (2013: € 158.4 million), a rise of 11 percent. Higher volumes and better prices had a positive effect here as well, as did the acquisition of Scil Proteins Production GmbH in Halle, Germany.
WACKER POLYSILICON profited from higher volumes and an increase in polysilicon prices. Sales amounted to € 1.05 billion (2013: € 924.2 million), up almost 14 percent year on year. Strong competition and excess capacity were again features of the market in 2014.
Siltronic posted a marked rise in 2014 sales, up 15 percent to € 853.4 million (2013: € 743.0 million). Here, the first-time consolidation of Siltronic Silicon Wafer Pte. Ltd. positively impacted the sales trend. At the same time, higher volumes more or less compensated for price declines.
Year-on-Year Sales Comparison
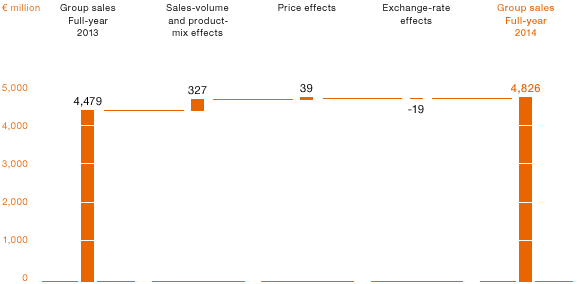

Higher volumes had a positive impact on sales, adding € 327 million. Price effects enhanced Group sales by € 39 million, while exchange-rate effects had a negative impact of € 19 million. The exchange rates of the US dollar, Japanese yen and Chinese renminbi to the euro played a decisive role here. The appreciation of the US dollar, especially in Q4 2014, benefited our sales. The major currencies developed as follows in relation to the euro:
Average Exchange Rate
| Download XLS |
|
|
|
|
||
|
|
2014 |
2013 |
||
|
|
|
|
||
|
US dollar |
1.33 |
1.36 |
||
|
Japanese yen |
140.50 |
136.61 |
||
|
Chinese renminbi |
8.18 |
8.29 |
||
|
|
|
|
WACKER generated the majority of its sales outside Germany. During 2014, international sales reached € 4.16 billion (2013: € 3.83 billion) or 86 percent of total sales. Asia is by far WACKER’s biggest market. WACKER delivers a large proportion of its polysilicon to Asia, and there is also strong demand from Asian customers for the Group’s silicone and polymer products.
Domestic and International Sales (by Customer Location)
| Download XLS |
|
|
|
|
||||||||||||
|
€ million |
2014 |
2013 |
2012 |
2011 |
2010 |
2009 |
2008 |
|||||||
|
|
|
|
|
|
|
|
|
|||||||
|
External sales |
4,826.4 |
4,478.9 |
4,634.9 |
4,909.7 |
4,748.4 |
3,719.3 |
4,298.1 |
|||||||
|
Of which Germany |
663.7 |
647.0 |
686.0 |
899.4 |
887.3 |
774.6 |
948.6 |
|||||||
|
Of which international |
4,162.7 |
3,831.9 |
3,948.9 |
4,010.3 |
3,861.1 |
2,944.7 |
3,349.5 |
|||||||
|
|
|
|
|
|
|
|
|
|||||||
Group EBITDA Exceeds € 1 Billion Due to Non-Recurring Effects
WACKER’s earnings before interest, taxes, depreciation and amortization (EBITDA) amounted to € 1,042.3 million in 2014 (2013: € 678.7 million), up by almost 54 percent on the prior year. The EBITDA margin rose significantly, from 15.2 percent to 21.6 percent. WACKER POLYSILICON benefited not only from non-recurring effects, but also from higher prices and volumes. That led to a sharp increase in EBITDA, which climbed to € 537.0 million (2013: € 233.9 million). The combination of high capacity utilization and cost-cutting measures caused operating costs to decline year on year. Despite higher volumes and, in some cases, higher prices, the chemical divisions were unable to increase EBITDA compared with the prior year. EBITDA came in at € 382.9 million after € 401.6 million a year earlier. In 2013, the use of provisions set aside in previous years to cover losses arising from purchase obligations in China had benefited chemical-division EBITDA in the amount of € 13.7 million. At Siltronic, the first-time consolidation of Siltronic Silicon Wafer Pte. Ltd. had a positive effect. EBITDA increased from € 26.5 million in 2013 to € 114.0 million in 2014. Silicon wafer prices were, on average, substantially lower than in 2013. However, measures taken to lower operating costs, coupled with high plant-utilization rates, led to an improvement in the cost of goods sold.
Non-recurring effects were one of the main reasons for the strong increase in EBITDA in 2014. WACKER POLYSILICON terminated or restructured contractual relationships with a number of solar-industry customers. In this connection, the division retained advance payments and received damages. That resulted in income of € 206.3 million (2013: € 77.6 million). Adjusted for this effect, Group EBITDA in 2014 was € 836.0 million (adjusted 2013: € 601.1 million), rising 39 percent and yielding an EBITDA margin of 17.3 percent.
WACKER’s earnings before interest and taxes (EBIT) reached € 443.3 million in 2014 (2013: € 114.3 million), thus almost quadrupling year on year. Adjusted for the special income already mentioned, EBIT amounted to € 237.0 million. Depreciation and impairments have an impact not only on EBITDA, but also on EBIT. Depreciation totaled € 589.5 million (2013: € 527.4 million). This increase of 12 percent was due, in particular, to the first-time inclusion of Siltronic Silicon Wafer Pte. Ltd. in the consolidated financial statements. Minor impairment losses of € 9.5 million were recognized (2013: € 37.0 million). The EBIT margin for 2014 was 9.2 percent (2013: 2.6 percent). The non-recurring effects that influenced both EBIT and EBITDA in 2014 are shown in the following table:
Non-Recurring Effects in 2014
| Download XLS |
|
|
|
|
|
€ million |
2014 |
|
|
|
|
|
|
Advance payments retained and damages received |
206.3 |
|
|
Total non-recurring effects on EBITDA |
206.3 |
|
|
|
|
Non-Recurring Effects in 2013
| Download XLS |
|
|
|
|
|
€ million |
2013 |
|
|
|
|
|
|
Use of provisions for losses from future purchase obligations in China |
13.7 |
|
|
Advance payments retained and damages received |
77.6 |
|
|
Total non-recurring effects on EBITDA |
91.3 |
|
|
Retirement and impairment of noncurrent assets at Siltronic |
-34.8 |
|
|
Total non-recurring effects on EBIT |
56.5 |
|
|
|
|
Cost of Goods Sold Up Slightly on Prior Year
Gross profit from sales climbed to € 844.2 million, up 27 percent year on year (2013: € 663.5 million). The gross margin amounted to almost 18 percent and was thus 3 percentage points higher than a year earlier, mainly the result of increased sales.
The cost of goods sold rose slightly in the reporting year. This was due in part to the first-time consolidation of Siltronic Silicon Wafer Pte. Ltd. The cost of goods sold came in at € 3.98 billion (2013: € 3.82 billion), up 4 percent. On the other hand, cost-cutting programs and high plant-utilization rates had positive effects, contributing toward good coverage of fixed costs. Overall, raw-material costs had a slightly negative impact on the cost of goods sold. The cost-of-sales ratio amounted to 83 percent in the reporting period, 2 percentage points better than in 2013 (85 percent).
Functional Costs Higher
Other functional costs (selling, R&D and general administrative expenses) were 5 percent higher year on year, rising to € 587.4 million (2013: € 557.5 million). R&D costs, in particular, increased in the reporting period, while higher personnel costs impacted all functions.
Other Operating Income and Expenses
In 2014, the balance of other operating income and expenses was € 183.5 million (2013: € 44.3 million). The positive result was mainly attributable to the advance payments retained and damages received in connection with terminated or restructured contracts with polysilicon customers. In the reporting period, this special income totaled € 206.3 million (2013: € 77.6 million). The Group posted a net exchange-rate gain of € 17.1 million in 2014. In the prior year, the comparable figure of € -2.8 million was nearly balanced. Other operating income and expenses also includes costs for the start-up of operations at the new production plant in Tennessee (USA).
Operating Result
Due to the effects described above, the operating result improved from € 150.3 million to € 440.3 million, thus more than doubling year on year.
Result from Investments in Joint Ventures and Associates
The investment result – the total income from investments in joint ventures and associates and other income from participations – amounted to € 3.0 million (2013: € -36.0 million). Since the beginning of 2014, Siltronic Silicon Wafer Pte. Ltd. has been fully included in WACKER’s consolidated financial statements. In the past, this former joint venture was accounted for using the equity method. Consequently, this company’s current earnings are now no longer recognized in the profit from investments in joint ventures and associates.
Financial and Net Interest Result
WACKER’s financial result was slightly better year on year, amounting to € -78.1 million compared with € -83.3 million in 2013. At € 8.4 million (2013: € 15.0 million), interest income was much lower, while interest expenses amounted to € 46.2 million (2013: € 41.8 million). The net interest result was € -37.8 million (2013: € -26.8 million). The effect of construction-related borrowing costs reduced interest expenses by € 5.1 million (2013: € 2.0 million).
The other financial result amounted to € -40.3 million (2013: € -56.5 million) and primarily comprised interest-bearing components of pension and other noncurrent provisions. It also included income and expenses from exchange-rate effects with respect to financial assets, which had a positive impact in 2014.
Income Taxes
For 2014, the Group reported tax expenses of € 169.8 million (2013: € 24.7 million). The Group’s tax rate was 46.5 percent (2013: 79.7 percent). The tax expenses were impacted by non-deductible start-up costs and losses incurred at some subsidiaries.
Consolidated Net Income
As a result of the effects mentioned, consolidated net income rose strongly to reach € 195.4 million (2013: € 6.3 million).
ROCE
The return on capital employed (ROCE) sets earnings before interest and taxes (EBIT) in relation to the capital employed for business activities.
In the reporting period, the return on capital employed (ROCE) reached 8.4 percent (2013: 2.2 percent), mainly as a result of higher net earnings. The higher ratio of tied-up capital due to our investments in new production facilities had only a minor effect on ROCE. Capital employed rose from € 5,238.2 million to € 5,260.7 million in 2014.
Combined Statement of Income
| Download XLS |
|
|
|
|
||||
|
€ million |
2014 |
2013 |
Change in % |
|||
|
|
|
|
|
|||
|
Sales |
4,826.4 |
4,478.9 |
7.8 |
|||
|
Gross profit from sales |
844.2 |
663.5 |
27.2 |
|||
|
Selling, R&D and general administrative expenses |
-587.4 |
-557.5 |
5.4 |
|||
|
Other operating income and expenses |
183.5 |
44.3 |
> 100 |
|||
|
Operating result |
440.3 |
150.3 |
> 100 |
|||
|
Result from investments in joint ventures and associates |
3.0 |
-36.0 |
n. a. |
|||
|
EBIT |
443.3 |
114.3 |
> 100 |
|||
|
Financial result |
-78.1 |
-83.3 |
-6.2 |
|||
|
Income before taxes |
365.2 |
31.0 |
> 100 |
|||
|
Income taxes |
-169.8 |
-24.7 |
> 100 |
|||
|
Net income for the year |
195.4 |
6.3 |
> 100 |
|||
|
Of which |
|
|
|
|||
|
Attributable to Wacker Chemie AG shareholders |
203.8 |
2.6 |
> 100 |
|||
|
Attributable to non-controlling interests |
-8.4 |
3.7 |
n. a. |
|||
|
|
|
|
|
|||
|
Earnings per common share (€) (basic / diluted) |
4.10 |
0.05 |
> 100 |
|||
|
Average number of shares outstanding (weighted) |
49,677,983 |
49,677,983 |
– |
|||
|
|
|
|
|
|||
|
Reconciliation to EBITDA |
|
|
|
|||
|
EBIT |
443.3 |
114.3 |
> 100 |
|||
|
Depreciation / appreciation of noncurrent assets |
599.0 |
564.4 |
6.1 |
|||
|
EBITDA |
1,042.3 |
678.7 |
53.6 |
|||
|
|
|
|
|
|||
|
ROCE (%) |
8.4 |
2.2 |
> 100 |
|||
|
|
|
|
|
|||