Earnings
Fiscal 2013 was marked by stable sales at WACKER’s three chemical divisions, persistent price pressure on silicon wafers and lower prices in the polysilicon segment. WACKER’s sales were lower and, as anticipated, its EBITDA was substantially reduced. The sluggish economy intensified competition in 2013, pushing down prices for standard products. Higher volumes and personnel cost savings only partially offset the pressure on prices in the three chemical divisions. Although prices remained at low levels at WACKER POLYSILICON, they did not decline any further. The agreement reached between the EU and China in their solar dispute revived the market in the second half of 2013, helping WACKER sell record volumes of polysilicon. Sales of silicon wafers for the semiconductor industry continued to decline, with lower prices and negative exchange-rate effects dampening sales growth. The Group’s net income for the year amounted to € 6.3 million, once again substantially lower than in the previous year (2012: € 114.7 million).
Sales Decrease 3 Percent to € 4.48 Billion
WACKER generated a total of € 4.48 billion in sales in 2013 (2012: € 4.63 billion), down 3.4 percent from a year earlier. Considerably lower prices for polysilicon and silicon wafers were the main reasons that Group sales were lower than a year ago. Performance differed across the Group’s business divisions in 2013 for a number of reasons.
Although WACKER’s chemical divisions succeeded in increasing their volumes compared with the previous year, price pressure and negative exchange-rate effects impeded sales growth. WACKER SILICONES and WACKER BIOSOLUTIONS managed to increase their sales slightly, while WACKER POLYMERS’ sales declined. Weaker dispersions business was the main reason for this decrease. WACKER POLYMERS generated sales of € 978.7 million (2012: € 1.00 billion), 2 percent down on the previous year. WACKER SILICONES, on the other hand, grew its sales by 1 percent year on year, to € 1.67 billion (2012: € 1.65 billion). WACKER BIOSOLUTIONS, too, posted a slight increase, with sales rising by 1 percent to € 158.4 million (2012: € 157.6 million).
WACKER POLYSILICON succeeded in selling record volumes of polysilicon, but sales were lower than in the previous year. Sales came in at € 924.2 million (2012: € 1.14 billion), a drop of just under 19 percent. This drop was caused by low polysilicon prices, which reached low levels toward the end of Q4 2012 and remained there for almost the whole of 2013. The agreement reached in late July between the European Union and China in connection with punitive tariffs for Chinese solar companies increased the volumes of polysilicon sold.
In 2013, Siltronic generated sales of € 743.0 million (2012: € 867.9 million), down 14 percent from a year earlier. Although volumes remained unchanged overall, the division had to come to terms with a substantial drop in silicon-wafer prices. Another factor dampening the price trend was the devaluation of the Japanese yen.
Year-on-Year Sales Comparison
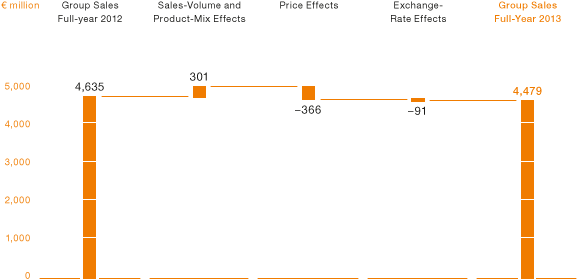

Higher volumes positively influenced sales, adding € 301 million, while exchange-rate effects had a negative impact of € 91 million. The dollar-euro and yen-euro exchange rates were the main factors in this trend. The average rate in 2013 was 1.36 dollars to the euro (2012: 1.29), while the average rate of the yen to the euro in the same period was 136.61 (2012: 102.50). Declining prices in particular lowered Group sales by € 366 million.
WACKER generated the majority of its sales outside Germany. In 2013, international sales reached € 3.83 billion (2012: € 3.95 billion), or 86 percent of total sales. Asia is clearly WACKER’s biggest market. WACKER delivers a large proportion of its polysilicon to Asia, and there is also strong demand from Asian customers for the Group’s silicone and polymer products.
Domestic and International Sales (by Customer Location)
| Download XLS |
|
|
|
|
||||||||||||
|
€ million |
2013 |
2012 |
2011 |
2010 |
2009 |
2008 |
2007 |
|||||||
|
|
|
|
|
|
|
|
|
|||||||
|
External sales |
4,478.9 |
4,634.9 |
4,909.7 |
4,748.4 |
3,719.3 |
4,298.1 |
3,781.3 |
|||||||
|
of which Germany |
647.0 |
686.0 |
899.4 |
887.3 |
774.6 |
948.6 |
723.5 |
|||||||
|
of which international |
3,831.9 |
3,948.9 |
4,010.3 |
3,861.1 |
2,944.7 |
3,349.5 |
3,057.8 |
|||||||
|
|
|
|
|
|
|
|
|
|||||||
EBITDA down 15 Percent Year on Year
In 2013, WACKER’s earnings before interest, taxes, depreciation and amortization (EBITDA) amounted to € 678.7 million (2012: € 795.4 million), down 14.7 percent from a year earlier. The EBITDA margin was 15.2 percent (2012: 17.2 percent). As in 2012, the low EBITDA figure was predominantly due to lower prices – in particular for silicon wafers and polysilicon – across all business divisions. At WACKER POLYSILICON, the EBITDA margin dropped from the prior-year’s 37.6 percent to 25.3 percent. The division had income of € 77.6 million (2012: € 113.1 million) from the retention of advance payments and from damages relating to the termination of contracts. In Q4 2013, WACKER SILICONES used provisions for purchase obligations, which had negatively impacted our silicone business. This enhanced EBITDA by € 13.7 million.
EBIT for the year amounted to € 114.3 million (2012: € 266.6 million) – a 57.1-percent decrease. Depreciation and impairments have an impact not only on EBITDA, but also on EBIT. Depreciation totaled € 527.4 million in 2013 (2012: € 526.3 million). WACKER also recognized overall impairments of € 37.0 million. Of this sum, € 34.8 million related to Siltronic. This mainly concerned noncurrent assets no longer in use. The EBIT margin for 2013 was 2.6 percent (2012: 5.8 percent). The non-recurring effects that influenced both EBIT and EBITDA in 2013 are shown in the following table:
Non-Recurring Effects in 2013
| Download XLS |
|
|
|
|
|
€ million |
2013 |
|
|
|
|
|
|
Use of provisions for losses from future purchase obligations in China |
13.7 |
|
|
Advance payments retained and damages received |
77.6 |
|
|
Total non-recurring effects on EBITDA |
91.3 |
|
|
Retirement and impairment of noncurrent assets at Siltronic |
-34.8 |
|
|
Total non-recurring effects on EBIT |
56.5 |
|
|
|
|
Non-Recurring Effects in 2012
| Download XLS |
|
|
|
|
|
€ million |
2012 |
|
|
|
|
|
|
Advance payments retained and damages received |
113.1 |
|
|
Obligations relating to the closure of the 150 mm line in Portland |
-14.8 |
|
|
Total non-recurring effects on EBITDA |
98.3 |
|
|
Total non-recurring effects on EBIT |
98.3 |
|
|
|
|
Cost of Goods Sold Remains at Same Level
Compared with the previous year, gross profit from sales fell by € 156.0 million to € 663.5 million (2012: € 819.5 million). That is a decline of 19 percent. The gross margin for 2013 was just under 15 percent. A year earlier, the figure had been 18 percent. This decline, too, was mainly due to markedly reduced sales margins for both silicon wafers and polysilicon.
At € 3.82 billion, the cost of goods sold remained unchanged in 2013 (2012: € 3.82 billion). Well-utilized production facilities provided for good coverage of fixed costs, while positive effects also came from a slight overall reduction in raw-material costs. In addition, a number of measures taken by WACKER helped to reduce the company’s material and personnel expenses. A reduction in inventories, though, had a contrary effect on the cost of sales in the second half of the year. The cost-of-sales ratio for the year stood at 85 percent (2012: 82 percent).
Functional Costs
Other functional costs (selling, R&D and general administrative expenses) were slightly lower than in the previous year, amounting to € 557.5 million (2012: € 571.7 million), a decrease of just under 3 percent.
Other Operating Income and Expenses
In 2013, the balance of other operating income and expenses was € 44.3 million (2012: € 101.3 million). This positive figure included income of € 77.6 million (2012: € 113.1 million) from the retention of advance payments and from damages relating to the termination of polysilicon contracts. Foreign currency gains and losses were almost balanced at € – 2.8 million (2012: € – 7.9 million). Impairments of noncurrent assets, particularly at Siltronic, in the amount of € 37.0 million were recognized as other operating expenses.
Operating Result
Due to the effects outlined above, the operating result fell from € 349.1 million to € 150.3 million, 57 percent down on one year earlier.
Result from Investments in Joint Ventures and Associates
The investment result – the total income from investments in joint ventures and associates and other income from participations – amounted to € – 36.0 million (2012: € – 82.5 million). This aggregate loss is attributable to investment losses from the 300 mm-wafer joint venture with Samsung, which were caused by high depreciation and lower prices. As expected, profits from the joint venture with Dow Corning for the production of siloxane in China declined significantly during 2013, a reduction that was due to the lower transfer prices for siloxane that WACKER had agreed with Dow Corning. The previous year’s investment result contained depreciation of € 77.0 million of the Group’s share in its joint venture Dow Corning (ZJG) Holding Co. Private Ltd., Singapore.
Financial and Net Interest Result
The Group’s financial result was € – 83.3 million (2012: € – 62.7 million), 33 percent down on one year earlier. The main reason for this decline was the company’s higher debt level and the associated interest expenses for financial liabilities. Interest expenses amounted to € 41.8 million (2012: € 26.2 million). The effect of construction-related borrowing costs reduced interest expenses only minimally, by € 2.0 million (2012: € 14.2 million). In 2013, the balance of interest income and interest expenses was € – 26.8 million (2012: € – 10.2 million). At € 15.0 million, interest income was almost unchanged over the previous year (2012: € 16.0 million).
The other financial result was € – 56.5 million (2012: € – 52.5 million) and primarily comprised interest-bearing components of pension and other noncurrent provisions. It also included income and expenses from the exchange-rate effects of financial investments.
Income Taxes
The Group reported tax expenses of € 24.7 million (2012: € 89.2 million). That is 72 percent less than a year earlier. The Group’s tax rate was 79.7 percent in 2013 (2012: 43.7 percent). The relatively high tax expenses primarily stemmed from the non-tax-deductible investment result and from expenses and losses of international subsidiaries, with low Group income before taxes overall.
Group Net Income
As a result of the above effects, consolidated net income decreased to € 6.3 million (2012: € 114.7 million).
ROCE
The return on capital employed (ROCE) sets earnings before interest and taxes (EBIT) in relation to the capital employed for business activities.
In 2013, the return on capital employed (ROCE) was 2.2 percent (2012: 5.2 percent), a year-on-year decrease mainly attributable to a decline in earnings and the increased commitment of funds to the construction of new production facilities. Capital employed rose from € 4,979.0 million to € 5,238.2 million in the year under review.
Combined Statement of Income
| Download XLS |
|
|
|
|
||||||
|
€ million |
2013 |
2012* |
Change in % |
|||||
|
|
|
|
|
|||||
|
||||||||
|
Sales |
4,478.9 |
4,634.9 |
-3.4 |
|||||
|
Gross profit from sales |
663.5 |
819.5 |
-19.0 |
|||||
|
Selling, R & D and general administrative expenses |
-557.5 |
-571.7 |
-2.5 |
|||||
|
Other operating income and expenses |
44.3 |
101.3 |
-56.3 |
|||||
|
Operating result |
150.3 |
349.1 |
-56.9 |
|||||
|
Result from investments in joint ventures and associates |
-36.0 |
-82.5 |
-56.4 |
|||||
|
EBIT |
114.3 |
266.6 |
-57.1 |
|||||
|
Financial result |
-83.3 |
-62.7 |
32.9 |
|||||
|
Income before taxes |
31.0 |
203.9 |
-84.8 |
|||||
|
Income taxes |
-24.7 |
-89.2 |
-72.3 |
|||||
|
Net income for the year |
6.3 |
114.7 |
-94.5 |
|||||
|
Of which |
|
|
|
|||||
|
Attributable to Wacker Chemie AG shareholders |
2.6 |
120.7 |
-97.8 |
|||||
|
Attributable to non-controlling interests |
3.7 |
-6.0 |
n. a. |
|||||
|
Earnings per common share (€) (basic /diluted) |
0.05 |
2.43 |
-97.9 |
|||||
|
|
|
|
|
|||||
|
Average number of shares outstanding (weighted) |
49,677,983 |
49,677,983 |
– |
|||||
|
|
|
|
|
|||||
|
Reconciliation to EBITDA |
|
|
|
|||||
|
EBIT |
114.3 |
266.6 |
-57.1 |
|||||
|
Depreciation /appreciation of noncurrent assets |
564.4 |
528.8 |
6.7 |
|||||
|
EBITDA |
678.7 |
795.4 |
-14.7 |
|||||
|
|
|
|
|
|||||
|
ROCE (%) |
2.2 |
5.2 |
n.a. |
|||||
|
|
|
|
|
|||||