Air
The Group’s Corporate Carbon Footprint report is an important tool for improving climate protection. After determining our indirect greenhouse gas emissions from bought-in energy (as per Greenhouse Gas Protocol Scope 2) for the first time in 2011, we have also been measuring our Scope 3 emissions since 2012. These include all emissions generated along the supply chain, e.g. by suppliers or through waste disposal and the transportation of products.
We have forwarded these emissions data to the Carbon Disclosure Project (CDP), which WACKER joined in 2007. Founded in London in 2000, CDP is a not-for-profit organization working to achieve greater transparency in greenhouse gas emissions.
WACKER is subject to European emissions trading at its Burghausen and Nünchritz CHP plants. The necessary emissions certificates were allotted to us free of charge for the 2008 – 2012 trading period. So far, WACKER has not been adversely affected by emissions trading.
In 2011, WACKER emitted 1,341,107 metric tons of carbon dioxide groupwide and 1,294,424 metric tons in 2012. Carbon dioxide makes up 98.5 percent of WACKER’s direct greenhouse gas emissions. The remaining 1.5 percent is made up of nitrous oxide, methane, fluorocarbons and other greenhouse gases. The rise in 2011’s emissions can be explained by increased capacity utilization as a result of the economic upturn.
| Download XLS |
|
Emissions to Air | ||||||||||||||
|
|
|
|
| |||||||||||
|
t |
20121 |
20111 |
20102 | |||||||||||
| ||||||||||||||
|
|
|
|
| |||||||||||
|
CO2 carbon dioxide |
|
|
| |||||||||||
|
Direct3 (t CO2) |
1,294,424 |
1,341,107 |
985,694 | |||||||||||
|
Indirect4 (t CO2) |
1,150,071 |
1,086,192 |
– | |||||||||||
|
|
|
|
| |||||||||||
|
Other Greenhouse Gases |
|
|
| |||||||||||
|
N2O nitrous oxide |
33.8 |
36.6 |
25 | |||||||||||
|
CH4 methane |
21.6 |
19.2 |
10 | |||||||||||
|
HFC hydrofluorocarbons |
5.2 |
3.5 |
5 | |||||||||||
|
PFC perfluorocarbons |
0.059 |
0.059 |
0.067 | |||||||||||
|
SF6 sulfur hexafluoride |
0.011 |
0.003 |
0.0008 | |||||||||||
| Download XLS |
|
Direct Greenhouse Gas Emissions | ||||||||||||||||
|
|
|
|
|
| ||||||||||||
|
t CO2e1 |
CO2 equivalent2 |
20123 |
20113 |
20104 | ||||||||||||
| ||||||||||||||||
|
|
|
|
|
| ||||||||||||
|
CO2 carbon dioxide |
1 |
1,294,424 |
1,341,107 |
985,694 | ||||||||||||
|
N2O nitrous oxide |
298 |
10,072 |
10,901 |
7,454 | ||||||||||||
|
CH4 methane |
25 |
539 |
481 |
256 | ||||||||||||
|
HFC hydrofluorocarbons |
1,430 |
7,442 |
5,046 |
7,164 | ||||||||||||
|
PFC perfluorocarbons |
9,800 |
577 |
577 |
596 | ||||||||||||
|
SF6 sulfur hexafluoride |
22,800 |
259 |
73 |
18 | ||||||||||||
Our indirect greenhouse gas emissions from procured energy (as per Greenhouse Gas Protocol Scope 2) rose by 5.9 percent in 2012. The main reason is production-capacity expansion for polysilicon, which entailed the commissioning of new facilities at the Nünchritz site.
| Download XLS |
|
Emissions of Air Pollutants | ||||||||||
|
|
|
|
| |||||||
|
t |
20121 |
20111 |
20102 | |||||||
| ||||||||||
|
|
|
|
| |||||||
|
NOx nitrogen oxides |
2,225 |
2,221 |
926 | |||||||
|
NMVOC non-methane volatile organic compounds |
418 |
396 |
415 | |||||||
|
CO carbon monoxide |
350 |
370 |
133 | |||||||
|
Dust |
600 |
620 |
48 | |||||||
|
Particulate matter |
500 |
510 |
27 | |||||||
The rise in nitrogen oxide emissions was due to the integration of the Holla site, the start-up of polysilicon facilities in Nünchritz, and a further rise in emissions at Burghausen following a maintenance-related shutdown of the gas turbine in 2010.
We used measurements and calculations at Burghausen to show that exposure to NOx/NH3 emissions in the site’s surroundings, on average, is in line with typical background concentrations. Overall nitrogen deposition is within the limits for maximum background levels in rural areas. We do not handle persistent organic pollutants (POPs) and thus comply with Regulation (EC) No. 850/2004, Annex 1, Part A.
Excluding the silicon-metal plant in Holla, Norway, dust emissions for 2012 totaled 37 metric tons (2011: 45 tons). Particulate matter emissions amounted to 21 metric tons in 2012 (2011: 22 metric tons), excluding Holla. The drop is due to fewer emissions at our US site in Calvert City. The emissions for Holla were also lower.
| Download XLS |
|
Emissions to Air, Business Divisions / Metallurgy | ||||||||||||||||||
|
|
|
|
|
|
|
| ||||||||||||
|
t |
2012 |
2011 |
2012 |
2011 |
2012 |
2011 | ||||||||||||
| ||||||||||||||||||
|
|
|
|
|
|
|
| ||||||||||||
|
Air |
|
|
|
|
|
| ||||||||||||
|
CO2 emissions |
1,294,424 |
1,341,1073 |
983,200 |
1,020,0003 |
310,800 |
321,000 | ||||||||||||
|
NOx nitrogen oxides |
2,225 |
2,221 |
1,072 |
1,052 |
1,153 |
1,169 | ||||||||||||
|
NMVOC non-methane volatile organic compounds |
418 |
396 |
411 |
389 |
7 |
7 | ||||||||||||
Investments and Projects for Reducing Emissions to Air
Through projects associated with the WOS (Wacker Operating System) program, we were able to reduce greenhouse gas emissions to air by around 3 percent in the period under review. One example of a project for increasing raw-material yields is the ethylene recovery facility designed for WACKER POLYMERS’ dispersions operations in Burghausen. Optimization measures that we implemented there have resulted in ethylene savings of 10 percent and reduced emissions.
In 2011, Siltronic’s Freiberg site installed an additional waste-gas purification and discharge system to reduce emissions to air. To prevent emissions to air, we have been cleaning hazardous substances off piping and equipment in a closed hall with a waste-gas treatment system since 2011 at Nünchritz.
When it comes to climate protection, production is not the only factor – our employees’ carbon footprint is also significant. We encourage them to leave their cars at home. We provide commuter buses for shift workers at Burghausen, our largest site. Together with 12 bus companies, we have set up some 60 bus routes within a 50-km radius. On average, 5,300 Burghausen site employees use the shuttle service every day. We also maintain a fleet of bicycles at the site and offer employees the possibility to recharge their e-bikes.
Furthermore, we encourage our employees to take the train when traveling between the Burghausen site and Munich headquarters. In October 2012, we negotiated a flat rate for this regular route with German Rail, which also includes the journey on Munich’s subway to the train station. In Burghausen, a shuttle bus transports employees arriving from Munich from the train station to the various destinations on site.
We offer shuttle buses from residential areas to WACKER’s Chinese sites in Nanjing, Shanghai and Zhangjiagang. Siltronic’s US site at Portland (Oregon) provides incentives – such as subsidized public transportation – to encourage employees to commute in an environmentally aware fashion. In Singapore, Siltronic has arranged for shuttle buses to travel from the site to various parts of the city. Employees at Siltronic in Japan have two car-free days a month, when they walk, bike, car share or use public transport to get to work.
Since 2011, our company car fleet in Germany has only included models that meet a minimum rating of “good” according to the safety and environmental assessment criteria issued by the German Automobile Association (ADAC). We have tightened the CO2 emissions limits for our company cars to a maximum of 120 to 190 g/km. As a result, we have lowered CO2 emissions by over 6 percent in the period under review, relative to an annual average of 30,000 km traveled per company car. By 2014, when all the older models have been replaced, our vehicle fleet’s annual CO2 emissions will have dropped by 10 percent.
During the period under review, we tested hydrogen-powered vehicles, but decided that electric vehicles are more suitable for us. The electric drive does not generate exhaust gases, is quiet and has low operating and maintenance costs, as it requires less servicing. A hydrogen-driven industrial truck currently costs 300 percent more than an electric vehicle. Added to this would be high costs for the necessary infrastructure measures.
We use electric drives for forklift trucks and the like. Over two thirds of the materials-handling equipment (lifting trucks, stackers and towing vehicles) at our Burghausen and Nünchritz sites now have electric motors. Groupwide, the switchover to energy-saving electric motors now covers other equipment, such as pumps and compressors.
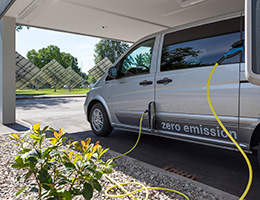
Two electric minibuses joined Burghausen’s company vehicle fleet in November 2012. Used to shuttle visitors across the site, these battery-operated models have replaced the two buses powered by conventional combustion engines.
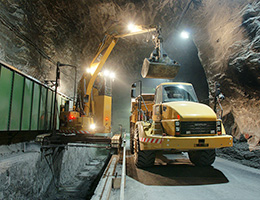
Since 2012, the Stetten salt mine has been using an electric excavator to handle backfill material, which is used to fill in the cavities created as salt is extracted. A diesel-powered excavator had previously been used below ground for this purpose.
Nünchritz: Integrated Heat-Recovery System and Further Process Enhancements Reduce Specific CO2 Emissions
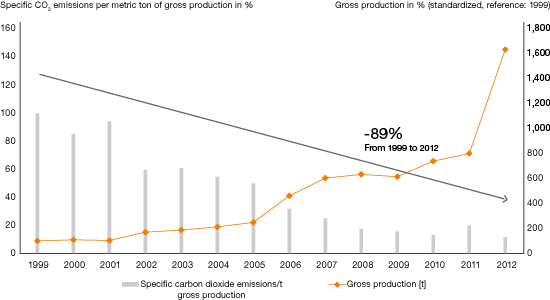
In Nünchritz, we hooked up distillation columns in 2005 to form a heat-recovery system to save energy and costs. Over recent years, we have systematically enhanced production processes and expanded the heat-recovery system. This has markedly reduced not only steam generation in our CHP plant but also specific CO2 emissions (emissions per net production volume). The 2011 increase was caused by polysilicon production going on stream.