Cash Flow
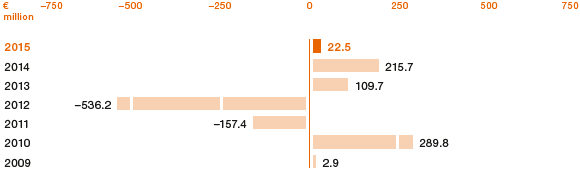
In 2015, WACKER complied with its long-term policy of financing its investments essentially from its own cash flow. Net cash flow totaled € 22.5 million in 2015 (2014: € 215.7 million), demonstrating that long-term investments are predominantly covered by the cash flow from operating activities.
Net Cash Flow
| Download XLS |
|
|
|
||
€ million |
2015 |
2014 |
||
|
|
|
||
Cash flow from operating activities (gross cash flow) |
617.2 |
485.2 |
||
Changes in advance payments received |
238.3 |
227.8 |
||
Cash flow from long-term investing activities before securities |
-815.6 |
-497.3 |
||
Additions from finance leases |
-17.4 |
– |
||
Net cash flow |
22.5 |
215.7 |
||
|
|
|
Net cash flow is the sum of cash flow from operating activities (excluding the change in advance payments) and cash flow from long-term investing activities (before securities), including finance leases.
Net Cash Flow

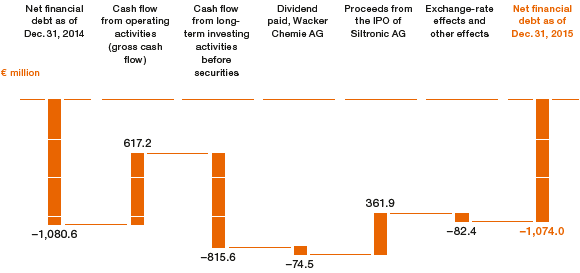
Net Financial Debt
Financing liabilities amounted to € 1.46 billion as of December 31, 2015 (Dec. 31, 2014: € 1.60 billion), down € 146.1 million year over year. In Q1 2015, the company repaid a € 150.0 million tranche of a promissory note (German Schuldschein). In addition, loans taken out to finance projects in China were redeemed. On the other hand, exchange-rate effects increased financial liabilities by around € 60 million.
WACKER defines net financial debt – which is one of its financial indicators – as the balance of gross financial debt (current and noncurrent financing liabilities) and existing noncurrent and current liquidity, consisting of securities, cash and cash equivalents. Net financial debt was more or less unchanged in 2015, decreasing by just € 6.6 million to € 1,074.0 million (Dec. 31, 2014: € 1,080.6 million). This figure was the result of contrasting effects: whereas the IPO of Siltronic AG resulted in a cash inflow of € 361.9 million, the funds needed for the high volume of capital expenditures – particularly for the polysilicon production site in Charleston, Tennessee (USA) – reduced liquidity. Overall, liquidity amounted to € 381.4 million as of December 31, 2015 (Dec. 31, 2014: € 520.9 million). In the reporting year, WACKER invested € 834.0 million, which corresponds to an investment ratio of 16 percent (2014: 12 percent), based on Group sales.
Aside from the financing liabilities disclosed in the report on net assets, WACKER has at its disposal adequate unused syndicated loans for around € 600 million, with maturities of over one year. Our existing lines of credit provide us with enough financial scope to secure the Group’s continued growth. The Group does not use any off-balance-sheet financing instruments.
Net Financial Debt

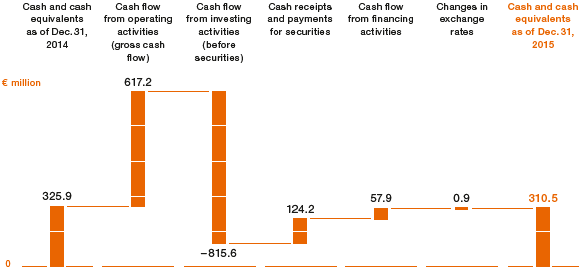
Trend in Cash and Cash Equivalents
Cash flow (with its components) shows the change in cash and cash equivalents in the period under review.
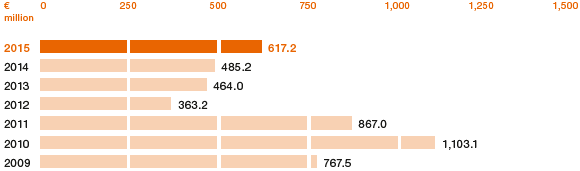
Gross Cash Flow
Cash flow from operations (gross cash flow) totaled € 617.2 million in 2015 (2014: € 485.2 million), up 27 percent. The higher net income for the period of € 241.8 million had a positive impact and included non-cash expenses and income amounting to € -39.1 million. Depreciation totaling € 575.4 million (2014: € 599.0 million) and changes in provisions in the amount of € 84.7 million had a positive effect on gross cash flow. The increase in working capital (trade receivables less trade payables, plus inventories) reduced gross cash flow by € 28.3 million. Cash payments increased to cover the higher volume of inventories, while trade receivables and payables were lower. As expected, advance payments received for polysilicon deliveries changed in the reporting year by € –238.3 million (2014: € –227.8 million) in line with the deliveries made and the advance payments retained in connection with terminated contracts. Previously deferred income taxes were paid in the financial year, which reduced gross cash flow. Employer contributions to the pension fund that were paid in advance in 2014 had a positive effect on cash flow from operations in 2015.
Cash Flow from Operating Activities (Gross Cash Flow)

Cash Flow from Investing Activities
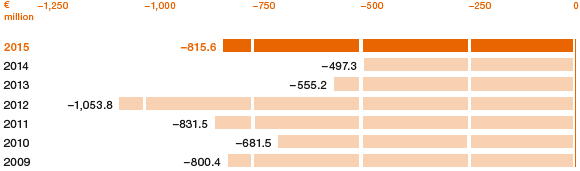
The Group’s investment projects influence cash flow from long-term investing activities. In 2015, 65 percent of investment spending went toward completion of the polysilicon production plant in Charleston, Tennessee (USA). Cash flow from long-term investing activities before securities increased from € –497.3 million in 2014 to € –815.6 million due to the high level of payments for projects. Acquisitions had led to a cash inflow of € 25.8 million in the previous year. This figure essentially represented the sum of cash and cash equivalents at Siltronic Silicon Wafer Pte. Ltd., which was included in the consolidated financial statements for the first time.
Cash Flow from Long-Term Investing Activities before Securities

Cash flow from investing activities during the reporting period amounted to € –691.4 million (2014: € –505.6 million). Apart from investments in fixed assets, it included cash receipts and payments for securities and fixed-term deposits with maturities of more than three months. In the reporting period, WACKER used its portfolio of securities and fixed-term deposits for financing purposes.
Cash Flow from Financing Activities
Cash flow from financing activities totaled € 57.9 million in 2015 (2014: € –88.6 million), and mainly comprised cash outflows of € 319.5 million to repay external financing liabilities and of € 99.8 million in new financing liabilities. The dividend payment by Wacker Chemie AG in the second quarter of 2015 also led to a cash outflow of € 74.5 million. Cash receipts from the change in ownership interests in Siltronic AG following the IPO in June 2015 increased cash flow from financing activities by € 361.9 million. In the previous year, funds had been used to repay Siltronic Silicon Wafer Pte. Ltd.’s external financing liabilities following Siltronic’s acquisition of a majority stake in that company. The capital payments and additional payments were used to redeem SSW’s bank loans. Cash and cash equivalents decreased by € 15.4 million compared with December 31, 2014 (€ 325.9 million), amounting to € 310.5 million as of December 31, 2015.
Changes in Cash and Cash Equivalents