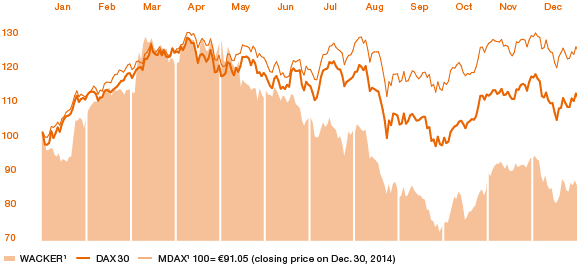
Performance of WACKER Stock Compared with DAX and MDAX
WACKER Share Performance (indexed to 100)1

Facts & Figures on Wacker Chemie AG’s Stock
| Download XLS |
|
||||||
€ |
|
|||||
|
|
|||||
|
||||||
Year-high (on March 11, 2015) |
115.1 |
|||||
Year-low (on Sept. 28, 2015) |
65.79 |
|||||
Year-end closing price (on Dec. 30, 2014) |
91.05 |
|||||
Year-end closing price (on Dec. 30, 2015) |
77.52 |
|||||
Performance for the year (without dividend) (%) |
14.86 |
|||||
Year-end market capitalization (shares outstanding; prior year: 4.5) (billion) |
3.85 |
|||||
Average daily trading volume1 (prior year: 18.0) (million) |
17.9 |
|||||
Earnings per share (prior year: 4.10) |
4.97 |
|||||
Dividend per share (proposal) |
2.00 |
|||||
Dividend yield2 (%) |
2.21 |
|||||
In full-year 2015, Germany’s DAX and MDAX indices gained 9.56 percent and 22.67 percent, respectively. WACKER’s share price, on the other hand, decreased by 14.7 percent during the same period. The stock started the year at € 90.85 (opening price on Jan. 2, 2015) and at year-end stood at € 77.52.