Sales and Marketing
Sales of WACKER Products Rise
Overall sales of our products were higher in 2015, due to higher volumes and positive exchange-rate effects. We increased revenues year over year at all of the business divisions.
Our business is characterized by high repeat-purchase rates. 95 percent of Siltronic’s 2015 product sales were transacted with customers we had supplied in 2014. At WACKER POLYMERS, the repeat-purchase rate was 97 percent (by sales), and the rate at WACKER SILICONES was somewhat over 90 percent. The repeat-purchase rate at WACKER POLYSILICON is not meaningful, since there are customers who have completely withdrawn from the solar business.
Global presence and proximity to customers are among the factors responsible for WACKER’s success. Efficient business processes play a significant role here. The experience accumulated over the years by regional sales teams combined with specific measures for improving productivity is at the focus of such processes. International project teams are working on interlinking and optimizing manual and digital sales processes. Another priority is to continue improving sales channels and structures.
WACKER customers can be categorized in three groups: global key accounts, customers, and distributors. Global key accounts are customers of special strategic significance for WACKER and those generating high sales levels. WACKER currently has 39 global key accounts, with which we generated around 25 percent of our 2015 revenue in the chemical divisions (WACKER SILICONES, WACKER POLYMERS and WACKER BIOSOLUTIONS). Over 55 percent of our chemical-related revenue was from our approximately 8,000 other active customer relationships and around 20 percent from distributors.
The share of sales transacted through electronic sales platforms continued to rise in 2015. Such platforms are in place in 73 countries. Worldwide, around 47 percent of our sales at the chemical divisions are processed using electronic sales channels. Asia is still at the fore, with over 50 percent.
Sales and Distribution Network Expanded
The chemical divisions’ distribution business posted a significant rise in sales in 2015, with the number of distribution partners (300) and the number of cross-regional distributor groups (5) remaining constant. Our 50 most important distributors generated around 80 percent of distribution sales revenue, unchanged from the previous year. In 2015, we reviewed and optimized our existing delivery channels and launched various initiatives for enhancing cooperation with our distributors.
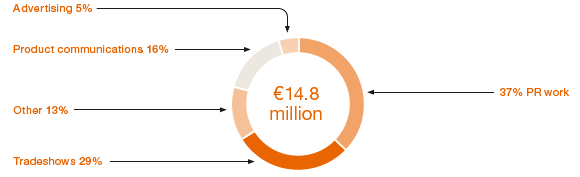
Marketing communications is a key element in strengthening WACKER’s branding and effectively promoting sales of our products. In 2015, we spent € 14.8 million (2014: € 15.2 million) on marketing communications.
Percentage of Marketing Costs

Attendance at 86 Tradeshows Worldwide
WACKER’s tradeshow presence remained at a high level in 2015. We had our own booth at a total of 86 tradeshows (2014: 81). The most important tradeshows for us in 2015 were the European Coatings Show in Nuremberg, where we presented our entire expertise in the areas of construction, coatings and adhesives; in-cosmetics in Barcelona; and Compamed, a medical tradeshow in Düsseldorf. We regularly analyze the qualitative and quantitative success of our tradeshow communications, with 30 shows reviewed in 2015 (2014: 24).
Tradeshows in 2015
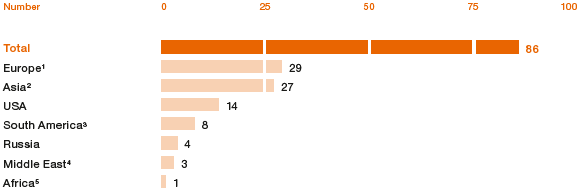

1 Austria, Belgium, Croatia, France, Germany, Italy, the Netherlands, Serbia, Spain, Sweden, Turkey, UK
2 China, India, Indonesia, Japan, Myanmar, South Korea, Thailand, Turkmenistan
3 Brazil
4 Dubai, Jordan
5 South Africa